|
|
|
|
|
|
|
|
|
|
|
|
|
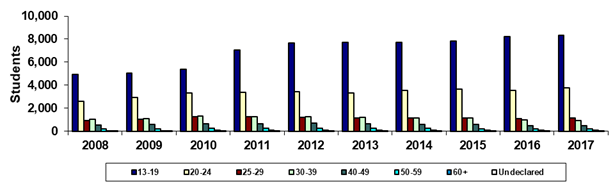
Chandler-Gilbert Community College |
|
Fall 45th Day Age Groups |
|
|
|
|
|
|
|
|
|
|
|
|
|
|
|
|
|
|
|
|
|
|
|
|
|
Year |
2008 |
2009 |
2010 |
2011 |
2012 |
2013 |
2014 |
2015 |
2016 |
2017 |
|
13-19 |
4,934 |
5,044 |
5,391 |
7,067 |
7,676 |
7,704 |
7,726 |
7,848 |
8,244 |
8,321 |
|
20-24 |
2,613 |
2,947 |
3,307 |
3,397 |
3,454 |
3,317 |
3,544 |
3,665 |
3,567 |
3,746 |
|
25-29 |
952 |
1,051 |
1,281 |
1,249 |
1,190 |
1,167 |
1,137 |
1,161 |
1,091 |
1,132 |
|
30-39 |
1,061 |
1,111 |
1,307 |
1,289 |
1,286 |
1,214 |
1,165 |
1,140 |
982 |
954 |
|
40-49 |
556 |
606 |
669 |
668 |
682 |
649 |
592 |
568 |
471 |
463 |
|
50-59 |
218 |
229 |
248 |
269 |
255 |
237 |
242 |
187 |
192 |
187 |
|
60+ |
57 |
66 |
85 |
85 |
107 |
109 |
91 |
82 |
81 |
100 |
|
Undeclared |
18 |
4 |
8 |
6 |
3 |
2 |
3 |
3 |
2 |
3 |
|
Sum of Colleges* |
10,409 |
11,058 |
12,296 |
14,030 |
14,653 |
14,399 |
14,500 |
14,654 |
14,630 |
14,906 |
|
|
|
|
|
|
|
|
|
|
|
|
|
% 13-19 |
47.4% |
45.6% |
43.8% |
50.4% |
52.4% |
53.5% |
53.3% |
53.6% |
56.3% |
55.8% |
|
% 20-24 |
25.1% |
26.7% |
26.9% |
24.2% |
23.6% |
23.0% |
24.4% |
25.0% |
24.4% |
25.1% |
|
% 25-29 |
9.1% |
9.5% |
10.4% |
8.9% |
8.1% |
8.1% |
7.8% |
7.9% |
7.5% |
7.6% |
|
% 30-39 |
10.2% |
10.0% |
10.6% |
9.2% |
8.8% |
8.4% |
8.0% |
7.8% |
6.7% |
6.4% |
|
% 40-49 |
5.3% |
5.5% |
5.4% |
4.8% |
4.7% |
4.5% |
4.1% |
3.9% |
3.2% |
3.1% |
|
% 50-59 |
2.1% |
2.1% |
2.0% |
1.9% |
1.7% |
1.6% |
1.7% |
1.3% |
1.3% |
1.3% |
|
% 60+ |
0.5% |
0.6% |
0.7% |
0.6% |
0.7% |
0.8% |
0.6% |
0.6% |
0.6% |
0.7% |
|
% Undeclared |
0.2% |
0.0% |
0.1% |
0.0% |
0.0% |
0.0% |
0.0% |
0.0% |
0.0% |
0.0% |
|
|
|
|
|
|
|
|
|
|
|
|
|
Print in landscape for best results |
Last updated on |
September 24, 2018 |
|
Source:
Official 45th Day headcount as reported by colleges. |
|
Maricopa Community College District • Office of
Institutional Effectiveness • Maricopa Trends |
|
|
|
|
|
|
|
|
|
|
|
|