|
|
|
|
|
|
|
|
|
|
|
|
|
Chandler-Gilbert Community College |
|
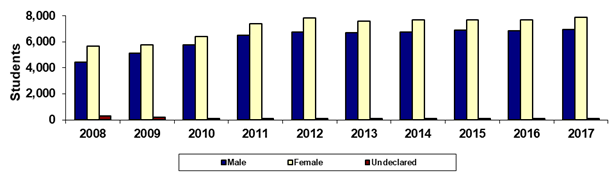
Fall 45th Day Gender |
|
|
|
|
|
|
|
|
|
|
|
|
|
|
|
|
|
|
|
|
|
|
|
|
|
Year |
2008 |
2009 |
2010 |
2011 |
2012 |
2013 |
2014 |
2015 |
2016 |
2017 |
|
Male |
4,446 |
5,114 |
5,760 |
6,523 |
6,737 |
6,716 |
6,736 |
6,901 |
6,858 |
6,942 |
|
Female |
5,655 |
5,761 |
6,412 |
7,396 |
7,822 |
7,593 |
7,675 |
7,659 |
7,674 |
7,872 |
|
Undeclared |
308 |
183 |
124 |
111 |
94 |
90 |
89 |
94 |
98 |
92 |
|
Total |
10,409 |
11,058 |
12,296 |
14,030 |
14,653 |
14,399 |
14,500 |
14,654 |
14,630 |
14,906 |
|
|
|
% Male |
42.7% |
46.2% |
46.8% |
46.5% |
46.0% |
46.6% |
46.5% |
47.1% |
46.9% |
46.6% |
|
% Female |
54.3% |
52.1% |
52.1% |
52.7% |
53.4% |
52.7% |
52.9% |
52.3% |
52.5% |
52.8% |
|
% Undeclared |
3.0% |
1.7% |
1.0% |
0.8% |
0.6% |
0.6% |
0.6% |
0.6% |
0.7% |
0.6% |
|
|
|
|
|
|
|
|
|
|
|
|
|
Print in landscape for best results |
Last updated on |
September 24, 2018 |
|
Source:
Official 45th Day headcount as reported by colleges. |
|
Maricopa Community College District • Office of
Institutional Effectiveness • Maricopa Trends |
|
|
|
|
|
|
|
|
|
|
|
|