|
|
|
|
|
|
|
|
|
|
|
|
|
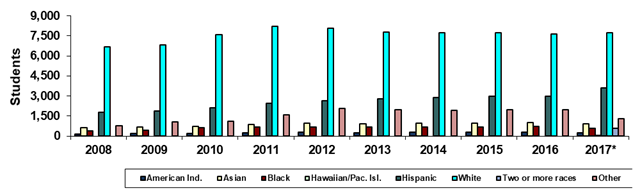
Chandler-Gilbert Community College |
|
Fall 45th Day Ethnicity |
|
|
|
|
|
|
|
|
|
|
|
|
|
|
Year |
2008 |
2009 |
2010 |
2011 |
2012 |
2013 |
2014 |
2015 |
2016 |
2017* |
|
American Ind. |
164 |
182 |
205 |
233 |
274 |
240 |
276 |
275 |
300 |
248 |
|
Asian |
645 |
674 |
702 |
869 |
940 |
938 |
982 |
985 |
1,022 |
894 |
|
Black |
385 |
449 |
627 |
693 |
690 |
679 |
699 |
685 |
717 |
574 |
|
Hawaiian/Pac. Isl. |
0 |
0 |
0 |
0 |
0 |
0 |
0 |
0 |
0 |
44 |
|
Hispanic |
1,766 |
1,881 |
2,096 |
2,462 |
2,630 |
2,775 |
2,866 |
2,982 |
2,993 |
3,584 |
|
White |
6,679 |
6,826 |
7,577 |
8,197 |
8,046 |
7,788 |
7,742 |
7,749 |
7,636 |
7,710 |
|
Two or more races |
0 |
0 |
0 |
0 |
0 |
0 |
0 |
0 |
0 |
574 |
|
Other |
770 |
1,046 |
1,089 |
1,576 |
2,073 |
1,979 |
1,935 |
1,978 |
1,962 |
1,278 |
|
Total |
10,409 |
11,058 |
12,296 |
14,030 |
14,653 |
14,399 |
14,500 |
14,654 |
14,630 |
14,906 |
|
|
|
|
|
|
|
|
|
|
|
|
|
% American Ind. |
1.6% |
1.6% |
1.7% |
1.7% |
1.9% |
1.7% |
1.9% |
1.9% |
2.1% |
1.7% |
|
% Asian |
6.2% |
6.1% |
5.7% |
6.2% |
6.4% |
6.5% |
6.8% |
6.7% |
7.0% |
6.0% |
|
% Black |
3.7% |
4.1% |
5.1% |
4.9% |
4.7% |
4.7% |
4.8% |
4.7% |
4.9% |
3.9% |
|
% Hawaiian/Pac. Isl. |
0.0% |
0.0% |
0.0% |
0.0% |
0.0% |
0.0% |
0.0% |
0.0% |
0.0% |
0.3% |
|
% Hispanic |
17.0% |
17.0% |
17.0% |
17.5% |
17.9% |
19.3% |
19.8% |
20.3% |
20.5% |
24.0% |
|
% White |
64.2% |
61.7% |
61.6% |
58.4% |
54.9% |
54.1% |
53.4% |
52.9% |
52.2% |
51.7% |
|
%Two or more races |
0.0% |
0.0% |
0.0% |
0.0% |
0.0% |
0.0% |
0.0% |
0.0% |
0.0% |
3.9% |
|
% Other |
7.4% |
9.5% |
8.9% |
11.2% |
14.1% |
13.7% |
13.3% |
13.5% |
13.4% |
8.6% |
|
|
|
|
|
|
|
|
|
|
|
|
|
Print in landscape for best results |
Last updated on |
September 24, 2018 |
|
Source:
Official 45th Day headcount as reported by colleges. |
|
Maricopa Community College District • Office of
Institutional Effectiveness • Maricopa Trends |
|
*Beginning in Fall 2017, race-ethnicity categories
changed to provide counts for "Hawaiian/Pacific Islander" and
"Two or more races." |
|
|
|
|
|
|
|
|
|
|
|
|
|
|
|
|
|
|
|
|
|
|
|
|