|
|
|
|
|
|
|
|
|
|
|
|
|
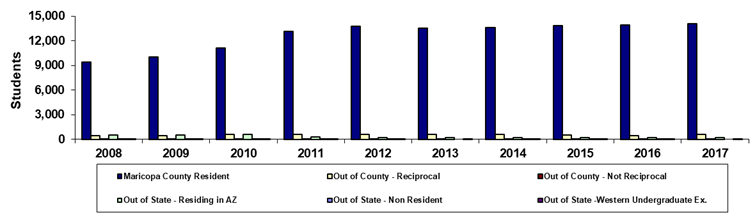
Chandler-Gilbert Community College |
|
|
|
|
|
|
|
|
|
|
|
|
|
|
|
|
|
|
|
|
|
|
|
|
|
|
|
|
|
|
|
|
|
|
|
|
|
|
|
|
|
|
|
|
|
|
|
|
|
|
|
|
|
|
|
|
|
|
|
|
|
|
|
|
|
|
|
|
|
|
|
|
|
|
|
|
|
|
|
|
|
|
|
|
|
|
|
|
|
|
|
|
|
|
|
|
|
|
|
|
|
|
|
|
|
|
|
|
|
|
|
|
|
|
|
|
|
|
|
|
|
|
|
|
|
|
|
|
|
|
|
|
|
|
|
|
|
|
|
|
|
|
|
|
|
|
|
Year |
2008 |
2009 |
2010 |
2011 |
2012 |
2013 |
2014 |
2015 |
2016 |
2017 |
|
Maricopa County Resident |
9,387 |
10,015 |
11,093 |
13,145 |
13,798 |
13,516 |
13,624 |
13,901 |
13,967 |
14,096 |
|
Out of County - Reciprocal |
430 |
478 |
585 |
586 |
573 |
603 |
592 |
538 |
439 |
561 |
|
Out of County - Not Reciprocal |
5 |
8 |
5 |
2 |
2 |
6 |
4 |
1 |
1 |
2 |
|
Out of State - Residing in AZ |
552 |
520 |
570 |
253 |
234 |
223 |
223 |
167 |
190 |
217 |
|
Out of State - Non Resident |
5 |
5 |
5 |
2 |
5 |
0 |
1 |
1 |
2 |
0 |
|
Out of State -Western Undergraduate Ex. |
30 |
32 |
38 |
42 |
41 |
51 |
56 |
46 |
31 |
30 |
|
Total |
10,409 |
11,058 |
12,296 |
14,030 |
14,653 |
14,399 |
14,500 |
14,654 |
14,630 |
14,906 |
|
|
|
|
|
|
|
|
|
|
|
|
|
%Maricopa County Resident |
90.2% |
90.6% |
90.2% |
93.7% |
94.2% |
93.9% |
94.0% |
94.9% |
95.5% |
94.6% |
|
%Out of County - Reciprocal |
4.1% |
4.3% |
4.8% |
4.2% |
3.9% |
4.2% |
4.1% |
3.7% |
3.0% |
3.8% |
|
%Out of County - Not Reciprocal |
0.0% |
0.1% |
0.0% |
0.0% |
0.0% |
0.0% |
0.0% |
0.0% |
0.0% |
0.0% |
|
%Out of State - Residing in AZ |
5.3% |
4.7% |
4.6% |
1.8% |
1.6% |
1.5% |
1.5% |
1.1% |
1.3% |
1.5% |
|
%Out of State - Non Resident |
0.0% |
0.0% |
0.0% |
0.0% |
0.0% |
0.0% |
0.0% |
0.0% |
0.0% |
0.0% |
|
%Out of State -Western Undergraduate Ex. |
0.3% |
0.3% |
0.3% |
0.3% |
0.3% |
0.4% |
0.4% |
0.3% |
0.2% |
0.2% |
|
|
|
|
|
|
|
|
|
|
|
|
|
Print in landscape for best results |
Last updated on |
September 24, 2018 |
|
Source:
Official 45th Day headcount as reported by colleges. |
|
Maricopa Community College District • Office of
Institutional Effectiveness • Maricopa Trends |
|
|
|
|
|
|
|
|
|
|
|
|