|
|
|
|
|
|
|
|
|
|
|
|
|
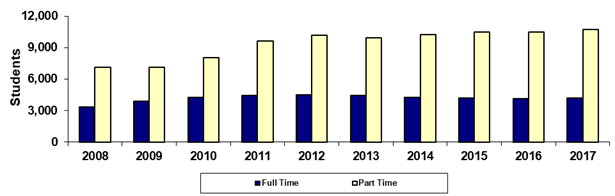
Chandler-Gilbert Community College |
|
Fall 45th Day Academic Load (Full and Part Time) |
|
|
|
|
|
|
|
|
|
|
|
|
|
|
Year |
2008 |
2009 |
2010 |
2011 |
2012 |
2013 |
2014 |
2015 |
2016 |
2017 |
|
Full Time |
3,315 |
3,922 |
4,277 |
4,424 |
4,501 |
4,472 |
4,238 |
4,193 |
4,151 |
4,178 |
|
Part Time |
7,094 |
7,136 |
8,019 |
9,606 |
10,152 |
9,927 |
10,262 |
10,461 |
10,479 |
10,728 |
|
Total |
10,409 |
11,058 |
12,296 |
14,030 |
14,653 |
14,399 |
14,500 |
14,654 |
14,630 |
14,906 |
|
|
|
|
|
|
|
|
|
|
|
|
|
% Full Time |
31.8% |
35.5% |
34.8% |
31.5% |
30.7% |
31.1% |
29.2% |
28.6% |
28.4% |
28.0% |
|
% Part Time |
68.2% |
64.5% |
65.2% |
68.5% |
69.3% |
68.9% |
70.8% |
71.4% |
71.6% |
72.0% |
|
|
|
|
|
|
|
|
|
|
|
|
|
Print in landscape for best results |
Last updated on |
September 24, 2018 |
|
Source:
Official 45th Day headcount as reported by colleges. |
|
Maricopa Community College District • Office of
Institutional Effectiveness • Maricopa Trends |
|
|
|
|
|
|
|
|
|
|
|
|