|
|
|
|
|
|
|
|
|
|
|
|
|
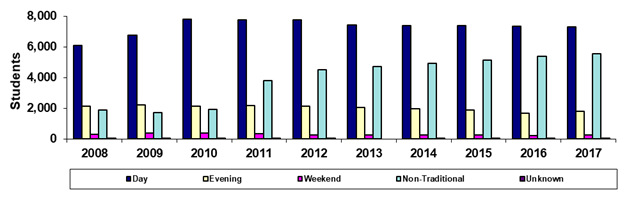
Chandler-Gilbert Community College |
|
Fall 45th Day Headcount by Primary Time of
Attendance |
|
|
|
|
|
|
|
|
|
|
|
|
|
|
Year |
2008 |
2009 |
2010 |
2011 |
2012 |
2013 |
2014 |
2015 |
2016 |
2017 |
|
Day |
6,072 |
6,751 |
7,806 |
7,749 |
7,744 |
7,412 |
7,385 |
7,383 |
7,314 |
7,295 |
|
Evening |
2,110 |
2,209 |
2,150 |
2,152 |
2,115 |
2,027 |
1,971 |
1,869 |
1,665 |
1,807 |
|
Weekend |
316 |
386 |
388 |
332 |
276 |
266 |
237 |
273 |
233 |
267 |
|
Non-Traditional |
1,889 |
1,694 |
1,938 |
3,784 |
4,515 |
4,694 |
4,906 |
5,128 |
5,383 |
5,525 |
|
Unknown |
22 |
18 |
14 |
13 |
3 |
0 |
1 |
1 |
35 |
12 |
|
Total |
10,409 |
11,058 |
12,296 |
14,030 |
14,653 |
14,399 |
14,500 |
14,654 |
14,630 |
14,906 |
|
|
|
|
|
|
|
|
|
|
|
|
|
% Day |
58.3% |
61.1% |
63.5% |
55.2% |
52.8% |
51.5% |
50.9% |
50.4% |
50.0% |
48.9% |
|
% Evening |
20.3% |
20.0% |
17.5% |
15.3% |
14.4% |
14.1% |
13.6% |
12.8% |
11.4% |
12.1% |
|
%Weekend |
3.0% |
3.5% |
3.2% |
2.4% |
1.9% |
1.8% |
1.6% |
1.9% |
1.6% |
1.8% |
|
%Non-Traditional |
18.1% |
15.3% |
15.8% |
27.0% |
30.8% |
32.6% |
33.8% |
35.0% |
36.8% |
37.1% |
|
%Unknown |
0.2% |
0.2% |
0.1% |
0.1% |
0.0% |
0.0% |
0.0% |
0.0% |
0.2% |
0.1% |
|
|
|
|
|
|
|
|
|
|
|
|
|
Print in landscape for best results |
Last updated on |
September 24, 2018 |
|
Source:
Official 45th Day headcount as reported by colleges. |
|
Maricopa Community College District • Office of
Institutional Effectiveness • Maricopa Trends |
|
|
|
|
|
|
|
|
|
|
|
|