|
|
|
|
|
|
|
|
|
|
|
|
|
|
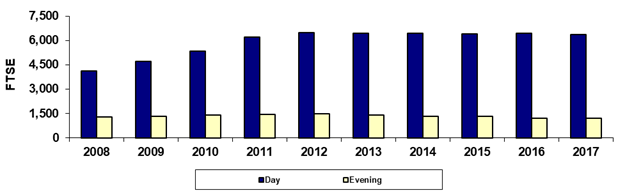
Chandler-Gilbert Community College |
|
|
Fall 45th Day Day/Evening FTSE |
|
|
|
|
|
|
|
|
|
|
|
|
|
|
|
|
|
|
|
|
|
|
|
|
|
|
|
|
|
|
|
|
|
|
|
|
|
|
|
|
|
|
|
|
|
|
|
|
|
|
|
|
|
|
|
|
|
|
|
|
|
|
|
|
|
|
|
|
|
|
|
|
|
|
|
|
|
|
|
|
|
|
|
|
|
|
|
|
|
|
|
|
|
|
|
|
|
|
|
|
|
|
|
|
|
|
|
|
|
|
|
|
|
|
|
|
|
|
|
|
|
|
|
|
|
|
|
|
|
|
|
|
|
|
|
|
|
|
|
|
|
|
|
|
|
|
|
|
|
|
|
|
|
|
|
|
|
|
Year |
2008 |
2009 |
2010 |
2011 |
2012 |
2013 |
2014 |
2015 |
2016 |
2017 |
|
|
Day |
4,125.6 |
4,693.3 |
5,337.1 |
6,193.6 |
6,470.6 |
6,433.5 |
6,431.1 |
6,401.8 |
6,445.6 |
6,351.4 |
|
|
Evening |
1,294.4 |
1,326.7 |
1,406.7 |
1,448.5 |
1,483.8 |
1,420.1 |
1,313.3 |
1,341.4 |
1,206.1 |
1,192.6 |
|
|
Total |
5,419.9 |
6,020.1 |
6,743.9 |
7,642.1 |
7,954.4 |
7,853.5 |
7,744.4 |
7,743.2 |
7,651.8 |
7,544.0 |
|
|
|
|
|
|
|
|
|
|
|
|
|
|
|
% Day |
76.1% |
78.0% |
79.1% |
81.0% |
81.3% |
81.9% |
83.0% |
82.7% |
84.2% |
84.2% |
|
|
% Evening |
23.9% |
22.0% |
20.9% |
19.0% |
18.7% |
18.1% |
17.0% |
17.3% |
15.8% |
15.8% |
|
|
|
|
|
|
|
|
|
|
|
|
|
|
|
Due to rounding, the sum of the numbers may not
equal the Total. |
|
|
Print in landscape for best results |
Last updated on |
September 24, 2018 |
|
|
Source:
Offical 45th Day FTSE numbers as reported by the colleges after manual
adjustments (unaudited). |
|
|
Maricopa Community College District • Office of
Institutional Effectiveness • Maricopa Trends |
|
|
|
|
|
|
|
|
|
|
|
|
|
|