|
|
|
|
|
|
|
|
|
|
|
|
|
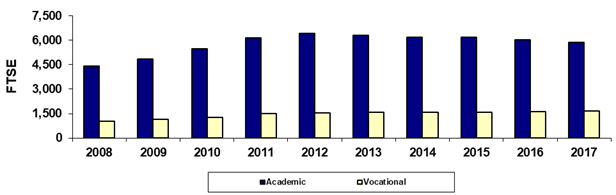
Chandler-Gilbert Community College |
|
Fall 45th Day Academic/Vocational FTSE |
|
|
|
|
|
|
|
|
|
|
|
|
|
|
Year |
2008 |
2009 |
2010 |
2011 |
2012 |
2013 |
2014 |
2015 |
2016 |
2017 |
|
Academic |
4,400.1 |
4,857.4 |
5,483.5 |
6,158.5 |
6,422.7 |
6,287.9 |
6,171.5 |
6,174.0 |
6,024.9 |
5,877.1 |
|
Vocational |
1,019.9 |
1,162.7 |
1,260.4 |
1,483.6 |
1,531.7 |
1,565.7 |
1,572.9 |
1,569.2 |
1,626.8 |
1,666.9 |
|
Total |
5,419.9 |
6,020.1 |
6,743.9 |
7,642.1 |
7,954.4 |
7,853.5 |
7,744.4 |
7,743.2 |
7,651.8 |
7,544.0 |
|
|
|
|
|
|
|
|
|
|
|
|
|
% Academic |
81.2% |
80.7% |
81.3% |
80.6% |
80.7% |
80.1% |
79.7% |
79.7% |
78.7% |
77.9% |
|
% Vocational |
18.8% |
19.3% |
18.7% |
19.4% |
19.3% |
19.9% |
20.3% |
20.3% |
21.3% |
22.1% |
|
|
|
|
|
|
|
|
|
|
|
|
|
Due to rounding, the sum of the numbers may not
equal the Total. |
|
|
Print in landscape for best results |
Last updated on |
September 24, 2018 |
|
Source:
Offical 45th Day FTSE numbers as reported by the colleges after manual
adjustments (unaudited). |
|
Maricopa Community College District • Office of
Institutional Effectiveness • Maricopa Trends |
|
|
|
|
|
|
|
|
|
|
|
|