|
|
|
|
|
|
|
|
|
|
|
|
|
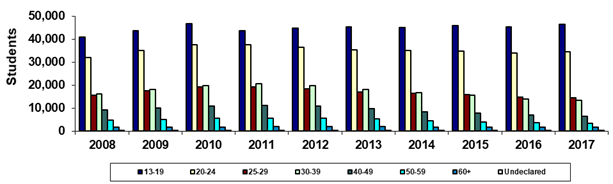
Maricopa County Community College District |
|
Fall 45th Day Age Groups |
|
Sum of College
(Duplicated) Headcount Totals |
|
(Students enrolled at more than one college in the
term are counted in the total more than once) |
|
|
|
|
|
|
|
|
|
|
|
|
|
|
Year |
2008 |
2009 |
2010 |
2011 |
2012 |
2013 |
2014 |
2015 |
2016 |
2017 |
|
13-19 |
40,852 |
43,805 |
46,781 |
43,719 |
44,888 |
45,240 |
45,012 |
45,984 |
45,485 |
46,569 |
|
20-24 |
31,879 |
35,135 |
37,476 |
37,669 |
36,348 |
35,289 |
35,118 |
34,919 |
34,091 |
34,425 |
|
25-29 |
15,506 |
17,490 |
19,318 |
19,220 |
18,388 |
17,099 |
16,382 |
15,826 |
14,847 |
14,424 |
|
30-39 |
16,033 |
18,056 |
19,868 |
20,476 |
19,865 |
17,973 |
16,773 |
15,676 |
14,031 |
13,373 |
|
40-49 |
9,114 |
10,139 |
10,884 |
11,221 |
10,841 |
9,873 |
8,490 |
7,928 |
6,922 |
6,498 |
|
50-59 |
4,797 |
5,113 |
5,480 |
5,688 |
5,620 |
5,335 |
4,552 |
4,005 |
3,565 |
3,246 |
|
60+ |
1,694 |
1,695 |
1,785 |
1,901 |
1,964 |
2,012 |
1,823 |
1,820 |
1,713 |
1,754 |
|
Undeclared |
221 |
151 |
112 |
85 |
68 |
56 |
62 |
46 |
32 |
37 |
|
Sum of Colleges* |
120,096 |
131,584 |
141,704 |
139,979 |
137,982 |
132,877 |
128,212 |
126,204 |
120,686 |
120,326 |
|
|
|
|
|
|
|
|
|
|
|
|
|
% 13-19 |
34.0% |
33.3% |
33.0% |
31.2% |
32.5% |
34.0% |
35.1% |
36.4% |
37.7% |
38.7% |
|
% 20-24 |
26.5% |
26.7% |
26.4% |
26.9% |
26.3% |
26.6% |
27.4% |
27.7% |
28.2% |
28.6% |
|
% 25-29 |
12.9% |
13.3% |
13.6% |
13.7% |
13.3% |
12.9% |
12.8% |
12.5% |
12.3% |
12.0% |
|
% 30-39 |
13.4% |
13.7% |
14.0% |
14.6% |
14.4% |
13.5% |
13.1% |
12.4% |
11.6% |
11.1% |
|
% 40-49 |
7.6% |
7.7% |
7.7% |
8.0% |
7.9% |
7.4% |
6.6% |
6.3% |
5.7% |
5.4% |
|
% 50-59 |
4.0% |
3.9% |
3.9% |
4.1% |
4.1% |
4.0% |
3.6% |
3.2% |
3.0% |
2.7% |
|
% 60+ |
1.4% |
1.3% |
1.3% |
1.4% |
1.4% |
1.5% |
1.4% |
1.4% |
1.4% |
1.5% |
|
% Undeclared |
0.2% |
0.1% |
0.1% |
0.1% |
0.0% |
0.0% |
0.0% |
0.0% |
0.0% |
0.0% |
|
|
|
|
|
|
|
|
|
|
|
|
|
Print in landscape for best results |
Last updated on |
September 24, 2018 |
|
Source:
Official 45th Day headcount as reported by colleges. |
|
Maricopa Community College District • Office of
Institutional Effectiveness • Maricopa Trends |
|
|
|
|
|
|
|
|
|
|
|
|
|
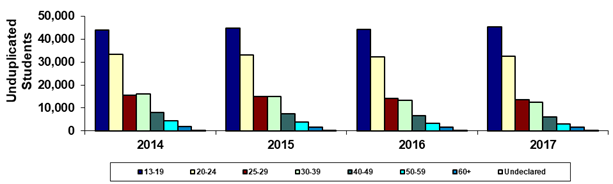
Maricopa County Community College District |
|
Fall 45th Day Age Groups |
|
District-wide Unduplicated Total |
|
(Each student is counted only once) |
|
 |
|
|
|
|
|
|
|
|
|
|
|
|
|
|
|
|
|
|
|
|
|
|
|
|
|
|
|
|
|
|
|
|
|
|
|
|
|
|
|
|
|
|
|
|
|
|
|
|
|
|
|
|
|
|
|
|
|
|
|
|
|
|
|
|
|
|
|
|
|
|
|
|
|
|
|
|
|
|
|
|
|
|
|
|
|
|
|
|
|
|
|
|
|
|
|
|
|
|
|
|
|
|
|
|
|
|
|
|
|
|
|
|
|
|
|
|
|
|
|
|
|
|
|
|
|
|
|
|
|
|
|
|
|
|
|
|
|
|
|
|
|
|
|
|
|
|
|
|
|
|
|
|
|
|
|
Year |
2014 |
2015 |
2016 |
2017 |
|
|
|
|
|
|
|
13-19 |
43,856 |
44,804 |
44,343 |
45,419 |
|
|
|
|
|
|
|
20-24 |
33,473 |
33,095 |
32,377 |
32,513 |
|
|
|
|
|
|
|
25-29 |
15,552 |
14,967 |
14,022 |
13,610 |
|
|
|
|
|
|
|
30-39 |
16,023 |
14,908 |
13,323 |
12,606 |
|
|
|
|
|
|
|
40-49 |
8,143 |
7,589 |
6,616 |
6,182 |
|
|
|
|
|
|
|
50-59 |
4,371 |
3,877 |
3,438 |
3,127 |
|
|
|
|
|
|
|
60+ |
1,788 |
1,763 |
1,668 |
1,721 |
|
|
|
|
|
|
|
Undeclared |
57 |
43 |
32 |
35 |
|
|
|
|
|
|
|
Unduplicated Total |
123,263 |
121,046 |
115,819 |
115,213 |
|
|
|
|
|
|
|
|
|
|
|
|
|
|
|
|
|
|
|
% 13-19 |
35.6% |
37.0% |
38.3% |
39.4% |
|
|
|
|
|
|
|
% 20-24 |
27.2% |
27.3% |
28.0% |
28.2% |
|
|
|
|
|
|
|
% 25-29 |
12.6% |
12.4% |
12.1% |
11.8% |
|
|
|
|
|
|
|
% 30-39 |
13.0% |
12.3% |
11.5% |
10.9% |
|
|
|
|
|
|
|
% 40-49 |
6.6% |
6.3% |
5.7% |
5.4% |
|
|
|
|
|
|
|
% 50-59 |
3.5% |
3.2% |
3.0% |
2.7% |
|
|
|
|
|
|
|
% 60+ |
1.5% |
1.5% |
1.4% |
1.5% |
|
|
|
|
|
|
|
% Undeclared |
0.0% |
0.0% |
0.0% |
0.0% |
|
|
|
|
|
|
|
|
|
|
|
|
|
|
|
|
|
|
|
Print in landscape for best results |
Last updated on |
September 24, 2018 |
|
Source:
Official 45th Day headcount as reported by colleges. |
|
Maricopa Community College District • Office of
Institutional Effectiveness • Maricopa Trends |
|
|
|
|
|
|
|
|
|
|
|
|