|
|
|
|
|
|
|
|
|
|
|
|
|
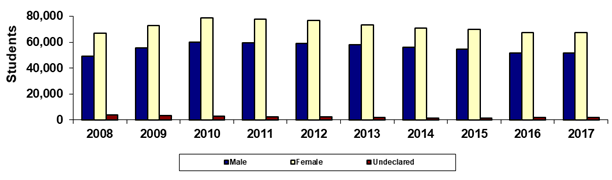
Maricopa County Community College District |
|
Fall 45th Day Gender |
|
Sum of College
(Duplicated) Headcount Totals |
|
(Students enrolled at more than one college in the
term are counted in the total more than once) |
|
|
|
|
|
|
|
|
|
|
|
|
|
|
|
|
|
|
|
|
|
|
|
|
|
|
|
|
|
|
|
|
|
|
|
|
|
|
|
|
|
|
|
|
|
|
|
|
|
|
|
|
|
|
|
|
|
|
|
|
|
|
|
|
|
|
|
|
|
|
|
|
|
|
|
|
|
|
|
|
|
|
|
|
|
|
|
|
|
|
|
|
|
|
|
|
|
|
|
|
|
|
|
|
|
|
|
|
|
|
|
|
|
|
|
|
|
|
|
|
|
|
|
|
|
|
|
|
|
|
|
|
|
|
|
|
|
|
|
|
|
|
|
|
|
Year |
2008 |
2009 |
2010 |
2011 |
2012 |
2013 |
2014 |
2015 |
2016 |
2017 |
|
Male |
49,197 |
55,462 |
60,104 |
59,680 |
59,159 |
57,869 |
55,911 |
54,706 |
51,692 |
51,406 |
|
Female |
67,099 |
72,823 |
78,938 |
77,925 |
76,660 |
73,245 |
70,691 |
69,894 |
67,292 |
67,171 |
|
Undeclared |
3,800 |
3,299 |
2,662 |
2,374 |
2,163 |
1,763 |
1,610 |
1,604 |
1,702 |
1,749 |
|
Sum of Colleges* |
120,096 |
131,584 |
141,704 |
139,979 |
137,982 |
132,877 |
128,212 |
126,204 |
120,686 |
120,326 |
|
|
|
% Male |
41.0% |
42.1% |
42.4% |
42.6% |
42.9% |
43.6% |
43.6% |
43.3% |
42.8% |
42.7% |
|
% Female |
55.9% |
55.3% |
55.7% |
55.7% |
55.6% |
55.1% |
55.1% |
55.4% |
55.8% |
55.8% |
|
% Undeclared |
3.2% |
2.5% |
1.9% |
1.7% |
1.6% |
1.3% |
1.3% |
1.3% |
1.4% |
1.5% |
|
|
|
|
|
|
|
|
|
|
|
|
|
Print in landscape for best results |
Last updated on |
September 24, 2018 |
|
Source:
Official 45th Day headcount as reported by colleges. |
|
Maricopa Community College District • Office of
Institutional Effectiveness • Maricopa Trends |
|
|
|
|
|
|
|
|
|
|
|
|
|
|
|
|
|
|
|
|
|
|
|
|
|
|
|
|
|
|
|
|
|
|
|
|
|
|
|
|
|
|
|
|
|
|
|
|
|
|
|
|
|
|
|
|
|
|
|
|
|
|
|
|
|
|
|
|
|
|
|
|
|
|
|
|
|
|
|
|
|
|
|
|
|
|
|
|
|
|
|
|
|
|
|
|
|
|
|
|
|
|
|
|
|
|
|
|
|
Maricopa County Community College District |
|
Fall 45th Day Gender |
|
District-wide Unduplicated Total |
|
(Each student is counted only once) |

|
|
|
|
|
|
|
|
|
|
|
|
|
|
|
|
|
|
|
|
|
|
|
|
|
|
|
|
|
|
|
|
|
|
|
|
|
|
|
|
|
|
|
|
|
|
|
|
|
|
|
|
|
|
|
|
|
|
|
|
|
|
|
|
|
|
|
|
|
|
|
|
|
|
|
|
|
|
|
|
|
|
|
|
|
|
|
|
|
|
|
|
|
|
|
|
|
|
|
|
|
|
|
|
|
|
|
|
|
|
|
|
|
|
|
|
|
|
|
|
|
|
|
|
|
|
|
|
|
|
|
|
|
|
|
|
|
|
|
|
|
|
|
|
|
Year |
2014 |
2015 |
2016 |
2017 |
|
|
|
|
|
|
|
Male |
53,839 |
52,573 |
49,672 |
49,291 |
|
|
|
|
|
|
|
Female |
67,833 |
66,892 |
64,489 |
64,225 |
|
|
|
|
|
|
|
Undeclared |
1,591 |
1,581 |
1,658 |
1,697 |
|
|
|
|
|
|
|
Unduplicated Total |
123,263 |
121,046 |
115,819 |
115,213 |
|
|
|
|
|
|
|
|
|
|
|
|
|
|
|
|
|
|
|
% Male |
43.7% |
43.4% |
42.9% |
42.8% |
|
|
|
|
|
|
|
% Female |
55.0% |
55.3% |
55.7% |
55.7% |
|
|
|
|
|
|
|
% Undeclared |
1.3% |
1.3% |
1.4% |
1.5% |
|
|
|
|
|
|
|
|
|
|
|
|
|
|
|
|
|
|
|
Print in landscape for best results |
Last updated on |
September 24, 2018 |
|
Source:
Official 45th Day headcount as reported by colleges. |
|
Maricopa Community College District • Office of
Institutional Effectiveness • Maricopa Trends |
|
|
|
|
|
|
|
|
|
|
|
|