|
|
|
|
|
|
|
|
|
|
|
|
|
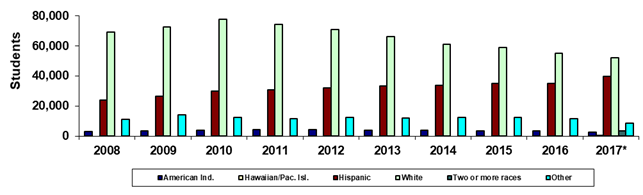
Maricopa County Community College District |
|
Fall 45th Day Ethnicity |
|
Sum of College
(Duplicated) Headcount Totals |
|
(Students enrolled at more than one college in the
term are counted in the total more than once) |
|
|
|
|
|
|
|
|
|
|
|
|
|
|
Year |
2008 |
2009 |
2010 |
2011 |
2012 |
2013 |
2014 |
2015 |
2016 |
2017* |
|
American Ind. |
3,130 |
3,595 |
4,081 |
4,240 |
4,210 |
3,843 |
3,746 |
3,524 |
3,463 |
2,791 |
|
Asian |
5,335 |
5,665 |
6,400 |
6,307 |
6,380 |
6,404 |
6,493 |
6,522 |
6,341 |
5,243 |
|
Black |
7,373 |
8,782 |
11,149 |
12,529 |
12,187 |
11,062 |
10,210 |
9,677 |
9,203 |
7,754 |
|
Hawaiian/Pac. Isl. |
0 |
0 |
0 |
0 |
0 |
0 |
0 |
0 |
0 |
361 |
|
Hispanic |
23,977 |
26,515 |
29,865 |
30,768 |
31,969 |
33,164 |
33,971 |
34,996 |
35,141 |
39,947 |
|
White |
69,059 |
72,726 |
77,759 |
74,327 |
70,793 |
66,231 |
61,227 |
59,133 |
55,079 |
52,086 |
|
Two or more races |
0 |
0 |
0 |
0 |
0 |
0 |
0 |
0 |
0 |
3,575 |
|
Other |
11,222 |
14,301 |
12,450 |
11,808 |
12,443 |
12,173 |
12,565 |
12,352 |
11,459 |
8,569 |
|
Sum of Colleges* |
120,096 |
131,584 |
141,704 |
139,979 |
137,982 |
132,877 |
128,212 |
126,204 |
120,686 |
120,326 |
|
|
|
|
|
|
|
|
|
|
|
|
|
% American Ind. |
2.6% |
2.7% |
2.9% |
3.0% |
3.1% |
2.9% |
2.9% |
2.8% |
2.9% |
2.3% |
|
% Asian |
4.4% |
4.3% |
4.5% |
4.5% |
4.6% |
4.8% |
5.1% |
5.2% |
5.3% |
4.4% |
|
% Black |
6.1% |
6.7% |
7.9% |
9.0% |
8.8% |
8.3% |
8.0% |
7.7% |
7.6% |
6.4% |
|
% Hawaiian/Pac. Isl. |
0.0% |
0.0% |
0.0% |
0.0% |
0.0% |
0.0% |
0.0% |
0.0% |
0.0% |
0.3% |
|
% Hispanic |
20.0% |
20.2% |
21.1% |
22.0% |
23.2% |
25.0% |
26.5% |
27.7% |
29.1% |
33.2% |
|
% White |
57.5% |
55.3% |
54.9% |
53.1% |
51.3% |
49.8% |
47.8% |
46.9% |
45.6% |
43.3% |
|
%Two or more races |
0.0% |
0.0% |
0.0% |
0.0% |
0.0% |
0.0% |
0.0% |
0.0% |
0.0% |
3.0% |
|
% Other |
9.3% |
10.9% |
8.8% |
8.4% |
9.0% |
9.2% |
9.8% |
9.8% |
9.5% |
7.1% |
|
|
|
|
|
|
|
|
|
|
|
|
|
Print in landscape for best results |
Last updated on |
September 24, 2018 |
|
Source:
Official 45th Day headcount as reported by colleges. |
|
Maricopa Community College District • Office of
Institutional Effectiveness • Maricopa Trends |
|
*Beginning in Fall 2017, race-ethnicity categories
changed to provide counts for "Hawaiian/Pacific Islander" and
"Two or more races." |
|
|
|
|
|
|
|
|
|
|
|
|
|
|
|
|
|
|
|
|
|
|
|
|
|
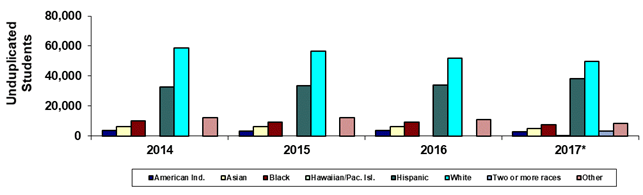
Maricopa County Community College District |
|
Fall 45th Day Ethnicity |
|
District-wide Unduplicated Total |
|
(Each student is counted only once) |
|
|
|
|
|
|
|
|
|
|
|
|
|
|
|
|
|
|
|
|
|
|
|
|
|
|
|
|
|
|
|
|
|
|
|
|
|
|
|
|
|
|
|
|
|
|
|
|
|
|
|
|
|
|
|
|
|
|
|
|
|
|
|
|
|
|
|
|
|
|
|
|
|
|
|
|
|
|
|
|
|
|
|
|
|
|
|
|
|
|
|
|
|
|
|
|
|
|
|
|
|
|
|
|
|
|
|
|
|
|
|
|
|
|
|
|
|
|
|
|
|
|
|
|
|
|
|
|
|
|
|
|
|
|
|
|
|
|
|
|
|
|
|
|
|
Year |
2014 |
2015 |
2016 |
2017* |
|
|
|
|
|
|
|
American Ind. |
3,635 |
3,408 |
3,498 |
2,711 |
|
|
|
|
|
|
|
Asian |
6,189 |
6,186 |
6,185 |
4,986 |
|
|
|
|
|
|
|
Black |
9,826 |
9,301 |
9,011 |
7,449 |
|
|
|
|
|
|
|
Hawaiian/Pac. Isl. |
0 |
0 |
0 |
341 |
|
|
|
|
|
|
|
Hispanic |
32,810 |
33,670 |
34,081 |
38,263 |
|
|
|
|
|
|
|
White |
58,520 |
56,397 |
52,048 |
49,629 |
|
|
|
|
|
|
|
Two or more races |
0 |
0 |
0 |
3,407 |
|
|
|
|
|
|
|
Other |
12,283 |
12,084 |
10,996 |
8,427 |
|
|
|
|
|
|
|
Unduplicated Total |
123,263 |
121,046 |
115,819 |
115,213 |
|
|
|
|
|
|
|
|
|
|
|
|
|
|
|
|
|
|
|
% American Ind. |
2.9% |
2.8% |
3.0% |
2.4% |
|
|
|
|
|
|
|
% Asian |
5.0% |
5.1% |
5.3% |
4.3% |
|
|
|
|
|
|
|
% Black |
8.0% |
7.7% |
7.8% |
6.5% |
|
|
|
|
|
|
|
% Hawaiian/Pac. Isl. |
0.0% |
0.0% |
0.0% |
0.3% |
|
|
|
|
|
|
|
% Hispanic |
26.6% |
27.8% |
29.4% |
33.2% |
|
|
|
|
|
|
|
% White |
47.5% |
46.6% |
44.9% |
43.1% |
|
|
|
|
|
|
|
%Two or more races |
0.0% |
0.0% |
0.0% |
3.0% |
|
|
|
|
|
|
|
% Other |
10.0% |
10.0% |
9.5% |
7.3% |
|
|
|
|
|
|
|
|
|
|
|
|
|
|
|
|
|
|
|
Print in landscape for best results |
Last updated on |
September 24, 2018 |
|
Source:
Official 45th Day headcount as reported by colleges. |
|
Maricopa Community College District • Office of
Institutional Effectiveness • Maricopa Trends |
|
*Beginning in Fall 2017, race-ethnicity categories
changed to provide counts for "Hawaiian/Pacific Islander" and
"Two or more races." |
|
|
|
|
|
|
|
|
|
|
|
|