|
|
|
|
|
|
|
|
|
|
|
|
|
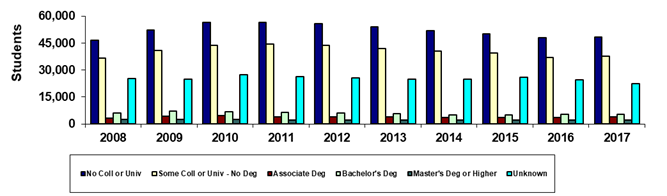
Maricopa County Community College District |
|
Fall 45th Day Admission Status |
|
Sum of College
(Duplicated) Headcount Totals |
|
(Students enrolled at more than one college in the
term are counted in the total more than once) |
|
|
|
|
|
|
|
|
|
|
|
|
|
|
|
|
|
|
|
|
|
|
|
|
|
|
|
|
|
|
|
|
|
|
|
|
|
|
|
|
|
|
|
|
|
|
|
|
|
|
|
|
|
|
|
|
|
|
|
|
|
|
|
|
|
|
|
|
|
|
|
|
|
|
|
|
|
|
|
|
|
|
|
|
|
|
|
|
|
|
|
|
|
|
|
|
|
|
|
|
|
|
|
|
|
|
|
|
|
|
|
|
|
|
|
|
|
|
|
|
|
|
|
|
|
|
|
|
|
|
|
|
|
|
|
|
|
|
|
|
|
|
|
|
|
|
|
Year |
2008 |
2009 |
2010 |
2011 |
2012 |
2013 |
2014 |
2015 |
2016 |
2017 |
|
No Coll or Univ |
46,615 |
52,207 |
56,558 |
56,482 |
56,011 |
54,197 |
51,905 |
50,049 |
48,169 |
48,268 |
|
Some Coll or Univ - No Deg |
36,496 |
40,763 |
43,758 |
44,399 |
43,922 |
41,915 |
40,538 |
39,337 |
37,155 |
37,864 |
|
Associate Deg |
3,294 |
4,169 |
4,712 |
4,068 |
3,895 |
3,794 |
3,559 |
3,720 |
3,537 |
4,119 |
|
Bachelor's Deg |
6,081 |
7,059 |
6,921 |
6,465 |
6,182 |
5,673 |
5,097 |
5,181 |
5,202 |
5,523 |
|
Master's Deg or Higher |
2,398 |
2,429 |
2,499 |
2,352 |
2,313 |
2,254 |
2,046 |
2,037 |
2,007 |
2,129 |
|
Unknown |
25,212 |
24,957 |
27,256 |
26,213 |
25,659 |
25,044 |
25,067 |
25,880 |
24,616 |
22,423 |
|
Sum of Colleges* |
120,096 |
131,584 |
141,704 |
139,979 |
137,982 |
132,877 |
128,212 |
126,204 |
120,686 |
120,326 |
|
|
|
|
|
|
|
|
|
|
|
|
|
|
|
|
|
|
|
|
|
|
|
|
|
% No Coll or Univ |
38.8% |
39.7% |
39.9% |
40.4% |
40.6% |
40.8% |
40.5% |
39.7% |
39.9% |
40.1% |
|
% Some Coll or Univ - No Deg |
30.4% |
31.0% |
30.9% |
31.7% |
31.8% |
31.5% |
31.6% |
31.2% |
30.8% |
31.5% |
|
% Associate Deg |
2.7% |
3.2% |
3.3% |
2.9% |
2.8% |
2.9% |
2.8% |
2.9% |
2.9% |
3.4% |
|
% Bachelor's Deg |
5.1% |
5.4% |
4.9% |
4.6% |
4.5% |
4.3% |
4.0% |
4.1% |
4.3% |
4.6% |
|
% Master's Deg or Higher |
2.0% |
1.8% |
1.8% |
1.7% |
1.7% |
1.7% |
1.6% |
1.6% |
1.7% |
1.8% |
|
% Unknown |
21.0% |
19.0% |
19.2% |
18.7% |
18.6% |
18.8% |
19.6% |
20.5% |
20.4% |
18.6% |
|
|
|
|
|
|
|
|
|
|
|
|
|
Print in landscape for best results |
|
|
|
|
|
|
Last updated on |
September 24, 2018 |
|
Source:
Official 45th Day headcount as reported by colleges. |
|
|
Maricopa Community College District • Office of
Institutional Effectiveness • Maricopa Trends |
|
|
|
|
|
|
|
|
|
|
|
|
|
|
|
|
|
|
|
|
|
|
|
|
|
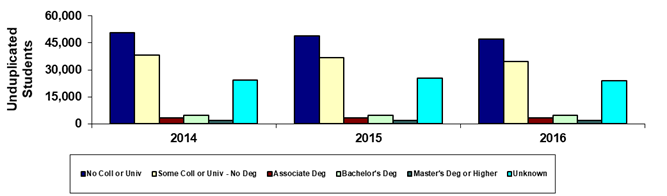
Maricopa County Community College District |
|
Fall 45th Day Admission Status |
|
District-wide Unduplicated Total |
|
(Each student is counted only once) |
|
|
|
|
|
|
|
|
|
|
|
|
|
|
|
|
|
|
|
|
|
|
|
|
|
|
Year |
2014 |
2015 |
2016 |
2017 |
|
|
|
|
|
|
|
No Coll or Univ |
50,707 |
48,792 |
47,024 |
47,150 |
|
|
|
|
|
|
|
Some Coll or Univ - No Deg |
38,034 |
36,787 |
34,708 |
35,122 |
|
|
|
|
|
|
|
Associate Deg |
3,332 |
3,438 |
3,270 |
3,822 |
|
|
|
|
|
|
|
Bachelor's Deg |
4,794 |
4,834 |
4,880 |
5,179 |
|
|
|
|
|
|
|
Master's Deg or Higher |
1,947 |
1,946 |
1,905 |
2,021 |
|
|
|
|
|
|
|
Unknown |
24,449 |
25,249 |
24,032 |
21,919 |
|
|
|
|
|
|
|
Unduplicated Total |
123,263 |
121,046 |
115,819 |
115,213 |
|
|
|
|
|
|
| |
|
|
|
|
|
|
|
|
|
|
|
|
% No Coll or Univ |
41.1% |
40.3% |
40.6% |
40.9% |
|
|
|
|
|
|
|
% Some Coll or Univ - No Deg |
30.9% |
30.4% |
30.0% |
30.5% |
|
|
|
|
|
|
|
% Associate Deg |
2.7% |
2.8% |
2.8% |
3.3% |
|
|
|
|
|
|
|
% Bachelor's Deg |
3.9% |
4.0% |
4.2% |
4.5% |
|
|
|
|
|
|
|
% Master's Deg or Higher |
1.6% |
1.6% |
1.6% |
1.8% |
|
|
|
|
|
|
|
% Unknown |
19.8% |
20.9% |
20.7% |
19.0% |
|
|
|
|
|
|
|
|
|
|
|
|
|
|
|
|
|
|
|
Print in landscape for best results |
|
|
|
|
|
|
Last updated on |
September 24, 2018 |
|
Source:
Official 45th Day headcount as reported by colleges. |
|
|
Maricopa Community College District • Office of
Institutional Effectiveness • Maricopa Trends |
|
|
|
|
|
|
|
|
|
|
|
|