|
|
|
|
|
|
|
|
|
|
|
|
|
Maricopa County Community College District |
|
Fall 45th Day High School Status |
|
Sum of College
(Duplicated) Headcount Totals |
|
(Students enrolled at more than one college in the
term are counted in the total more than once) |
|
|
|
|
|
|
|
|
|
|
|
|
|
|
|
|
|
|
|
|
|
|
|
|
|
|
|
|
|
|
|
|
|
|
|
|
|
|
|
|
|
|
|
|
|
|
|
|
|
|
|
|
|
|
|
|
|
|
|
|
|
|
|
|
|
|
|
|
|
|
|
|
|
|
|
|
|
|
|
|
|
|
|
|
|
|
|
|
|
|
|
|
|
|
|
|
|
|
|
|
|
|
|
|
|
|
|
|
|
|
|
|
|
|
|
|
|
|
|
|
|
|
|
|
|
|
|
|
|
|
|
|
|
|
|
|
|
|
|
|
|
|
|
|
|
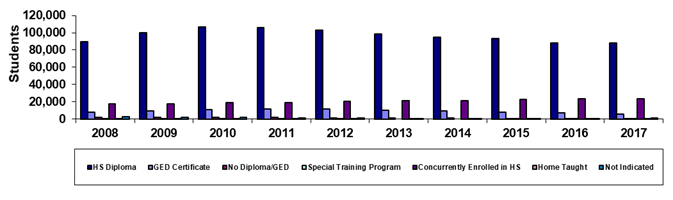
Year |
2008 |
2009 |
2010 |
2011 |
2012 |
2013 |
2014 |
2015 |
2016 |
2017 |
|
HS Diploma |
89,778 |
99,806 |
106,721 |
105,716 |
102,678 |
98,654 |
95,028 |
93,210 |
88,232 |
88,295 |
|
GED Certificate |
7,567 |
9,163 |
10,931 |
11,826 |
11,821 |
10,419 |
9,305 |
8,057 |
6,814 |
6,014 |
|
No Diploma/GED |
2,064 |
2,082 |
2,289 |
1,838 |
1,521 |
1,118 |
917 |
806 |
648 |
625 |
|
Special Training Program |
9 |
4 |
2 |
4 |
1 |
0 |
0 |
1 |
2 |
1 |
|
Concurrently Enrolled in HS |
17,216 |
17,909 |
19,297 |
18,698 |
20,199 |
21,179 |
21,557 |
22,753 |
23,548 |
23,483 |
|
Home Taught |
498 |
648 |
759 |
781 |
747 |
753 |
678 |
675 |
706 |
730 |
|
Not Indicated |
2,964 |
1,972 |
1,705 |
1,116 |
1,015 |
754 |
727 |
702 |
736 |
1,178 |
|
Sum of Colleges* |
120,096 |
131,584 |
141,704 |
139,979 |
137,982 |
132,877 |
128,212 |
126,204 |
120,686 |
120,326 |
|
|
|
|
|
|
|
|
|
|
|
|
|
%HS Diploma |
74.8% |
75.8% |
75.3% |
75.5% |
74.4% |
74.2% |
74.1% |
73.9% |
73.1% |
73.4% |
|
%GED Certificate |
6.3% |
7.0% |
7.7% |
8.4% |
8.6% |
7.8% |
7.3% |
6.4% |
5.6% |
5.0% |
|
%No Diploma/GED |
1.7% |
1.6% |
1.6% |
1.3% |
1.1% |
0.8% |
0.7% |
0.6% |
0.5% |
0.5% |
|
%Special Training Program |
0.0% |
0.0% |
0.0% |
0.0% |
0.0% |
0.0% |
0.0% |
0.0% |
0.0% |
0.0% |
|
%Concurrently Enrolled in HS |
14.3% |
13.6% |
13.6% |
13.4% |
14.6% |
15.9% |
16.8% |
18.0% |
19.5% |
19.5% |
|
%Home Taught |
0.4% |
0.5% |
0.5% |
0.6% |
0.5% |
0.6% |
0.5% |
0.5% |
0.6% |
0.6% |
|
%Not Indicated |
2.5% |
1.5% |
1.2% |
0.8% |
0.7% |
0.6% |
0.6% |
0.6% |
0.6% |
1.0% |
|
|
|
|
|
|
|
|
|
|
|
|
|
|
|
|
|
|
|
|
|
|
|
|
|
Print in landscape for best results |
|
|
Last updated on |
September 24, 2018 |
|
Source:
Official 45th Day headcount as reported by colleges. |
|
Maricopa Community College District • Office of
Institutional Effectiveness • Maricopa Trends |
|
|
|
|
|
|
|
|
|
|
|
|
|
Maricopa County Community College District |
|
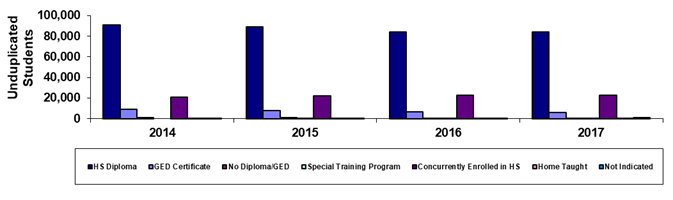
Fall 45th Day High School Status |
|
District-wide Unduplicated Total |
|
(Each student is counted only once) |
|
|
|
|
|
|
|
|
|
|
|
|
|
|
Year |
2014 |
2015 |
2016 |
2017 |
|
|
HS Diploma |
90,961 |
88,977 |
84,198 |
83,947 |
|
|
GED Certificate |
9,043 |
7,781 |
6,563 |
5,779 |
|
|
No Diploma/GED |
903 |
795 |
635 |
605 |
|
|
Special Training Program |
0 |
1 |
2 |
1 |
|
|
Concurrently Enrolled in HS |
21,012 |
22,181 |
23,041 |
23,060 |
|
|
Home Taught |
638 |
628 |
656 |
670 |
|
|
Not Indicated |
706 |
683 |
724 |
1,151 |
|
|
Unduplicated Total |
123,263 |
121,046 |
115,819 |
115,213 |
|
|
|
%HS Diploma |
73.8% |
73.5% |
72.7% |
72.9% |
|
|
%GED Certificate |
7.3% |
6.4% |
5.7% |
5.0% |
|
|
%No Diploma/GED |
0.7% |
0.7% |
0.5% |
0.5% |
|
|
%Special Training Program |
0.0% |
0.0% |
0.0% |
0.0% |
|
|
%Concurrently Enrolled in HS |
17.0% |
18.3% |
19.9% |
20.0% |
|
|
%Home Taught |
0.5% |
0.5% |
0.6% |
0.6% |
|
|
%Not Indicated |
0.6% |
0.6% |
0.6% |
1.0% |
|
|
|
Print in landscape for best results |
|
|
Last updated on |
September 24, 2018 |
|
Source:
Official 45th Day headcount as reported by colleges. |
|
Maricopa Community College District • Office of
Institutional Effectiveness • Maricopa Trends |
|
|
|
|
|
|
|
|
|
|
|
|