|
|
|
|
|
|
|
|
|
|
|
|
|
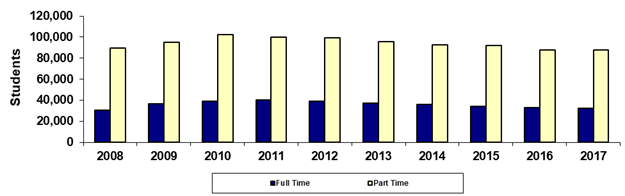
Maricopa County Community College District |
|
Fall 45th Day Academic Load (Full and Part Time) |
|
Sum of College
(Duplicated) Headcount Totals |
|
(Students enrolled at more than one college in the
term are counted in the total more than once) |
|
|
|
|
|
|
|
|
|
|
|
|
|
|
Year |
2008 |
2009 |
2010 |
2011 |
2012 |
2013 |
2014 |
2015 |
2016 |
2017 |
|
Full Time |
30,206 |
36,679 |
39,226 |
40,310 |
38,886 |
37,269 |
35,720 |
34,284 |
33,186 |
32,310 |
|
Part Time |
89,890 |
94,905 |
102,478 |
99,669 |
99,096 |
95,608 |
92,492 |
91,920 |
87,500 |
88,016 |
|
Sum of Colleges* |
120,096 |
131,584 |
141,704 |
139,979 |
137,982 |
132,877 |
128,212 |
126,204 |
120,686 |
120,326 |
|
|
|
|
|
|
|
|
|
|
|
|
|
% Full Time |
25.2% |
27.9% |
27.7% |
28.8% |
28.2% |
28.0% |
27.9% |
27.2% |
27.5% |
26.9% |
|
% Part Time |
74.8% |
72.1% |
72.3% |
71.2% |
71.8% |
72.0% |
72.1% |
72.8% |
72.5% |
73.1% |
|
|
|
|
|
|
|
|
|
|
|
|
|
Print in landscape for best results |
Last updated on |
September 24, 2018 |
|
Source:
Official 45th Day headcount as reported by colleges. |
|
Maricopa Community College District • Office of
Institutional Effectiveness • Maricopa Trends |
|
|
|
|
|
|
|
|
|
|
|
|
|
|
|
|
|
|
|
|
|
|
|
|
|
|
|
|
|
|
|
|
|
|
|
|
|
|
|
|
|
|
|
|
|
|
|
|
|
|
|
|
|
|
|
|
|
|
|
|
|
|
|
|
|
|
|
|
|
|
|
|
|
|
|
|
|
|
|
|
|
|
|
|
|
|
|
|
|
|
|
|
|
|
|
|
|
|
|
|
|
|
|
|
|
|
|
|
|
|
|
|
|
|
|
|
|
|
|
|
|
|
|
|
|
|
|
|
|
|
|
|
|
|
|
|
|
|
|
|
|
|
|
|
|
Maricopa County Community College District |
|
Fall 45th Day Academic Load (Full and Part Time) |
|
District-wide Unduplicated Total |
|
(Each student is counted only once) |
|
|
|
|
|
|
|
|
|
|
|
|
|
|
Year |
2014 |
2015 |
2016 |
2017 |
|
|
|
|
|
|
|
Full Time |
40,645 |
38,930 |
37,409 |
36,516 |
|
|
|
|
|
|
|
Part Time |
82,618 |
82,116 |
78,410 |
78,697 |
|
|
|
|
|
|
|
Unduplicated Total |
123,263 |
121,046 |
115,819 |
115,213 |
|
|
|
|
|
|
|
|
|
|
|
|
|
|
|
|
|
|
|
% Full Time |
33.0% |
32.2% |
32.3% |
31.7% |
|
|
|
|
|
|
|
% Part Time |
67.0% |
67.8% |
67.7% |
68.3% |
|
|
|
|
|
|
|
|
|
|
|
|
|
|
|
|
|
|
|
Print in landscape for best results |
Last updated on |
September 24, 2018 |
|
Source:
Official 45th Day headcount as reported by colleges. |
|
Maricopa Community College District • Office of
Institutional Effectiveness • Maricopa Trends |
|
|
|
|
|
|
|
|
|
|
|
|