|
|
|
|
|
|
|
|
|
|
|
|
|
|
|
|
|
|
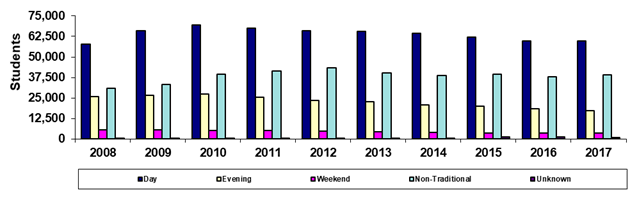
Maricopa County Community College District |
|
|
|
|
|
|
Fall 45th Day Headcount by Primary Time of
Attendance |
|
|
|
|
|
|
Sum of College
(Duplicated) Headcount Totals |
|
|
|
|
|
|
(Students enrolled at more than one college in the
term are counted in the total more than once) |
|
|
|
|
|
|
|
|
|
|
|
|
|
|
|
|
|
|
|
|
|
|
|
|
|
|
|
|
|
|
|
|
|
|
|
|
|
|
|
|
|
|
|
|
|
|
|
|
|
|
|
|
|
|
|
|
|
|
|
|
|
|
|
|
|
|
|
|
|
|
|
|
|
|
|
|
|
|
|
Year |
2008 |
2009 |
2010 |
2011 |
2012 |
2013 |
2014 |
2015 |
2016 |
2017 |
|
|
|
|
|
|
Day |
57,674 |
66,107 |
69,706 |
67,674 |
66,035 |
65,562 |
64,482 |
62,096 |
59,866 |
59,657 |
|
|
|
|
|
|
Evening |
25,934 |
26,726 |
27,282 |
25,533 |
23,633 |
22,760 |
20,896 |
19,940 |
18,207 |
17,234 |
|
|
|
|
|
|
Weekend |
5,397 |
5,319 |
5,091 |
4,980 |
4,716 |
4,251 |
3,844 |
3,506 |
3,494 |
3,486 |
|
|
|
|
|
|
Non-Traditional |
30,849 |
33,233 |
39,468 |
41,593 |
43,458 |
40,053 |
38,877 |
39,620 |
37,953 |
39,029 |
|
|
|
|
|
|
Unknown |
242 |
199 |
157 |
199 |
140 |
251 |
113 |
1,042 |
1,166 |
920 |
|
|
|
|
|
|
Sum of Colleges* |
120,096 |
131,584 |
141,704 |
139,979 |
137,982 |
132,877 |
128,212 |
126,204 |
120,686 |
120,326 |
|
|
|
|
|
|
|
|
|
|
|
|
|
|
|
|
|
|
|
|
|
|
|
% Day |
48.0% |
50.2% |
49.2% |
48.3% |
47.9% |
49.3% |
50.3% |
49.2% |
49.6% |
49.6% |
|
|
|
|
|
|
% Evening |
21.6% |
20.3% |
19.3% |
18.2% |
17.1% |
17.1% |
16.3% |
15.8% |
15.1% |
14.3% |
|
|
|
|
|
|
%Weekend |
4.5% |
4.0% |
3.6% |
3.6% |
3.4% |
3.2% |
3.0% |
2.8% |
2.9% |
2.9% |
|
|
|
|
|
|
%Non-Traditional |
25.7% |
25.3% |
27.9% |
29.7% |
31.5% |
30.1% |
30.3% |
31.4% |
31.4% |
32.4% |
|
|
|
|
|
|
%Unknown |
0.2% |
0.2% |
0.1% |
0.1% |
0.1% |
0.2% |
0.1% |
0.8% |
1.0% |
0.8% |
|
|
|
|
|
|
|
|
|
|
|
|
|
|
|
|
|
|
|
|
|
|
|
Print in landscape for best results |
Last updated on |
September 24, 2018 |
|
|
|
|
|
|
Source:
Official 45th Day headcount as reported by colleges. |
|
|
|
|
|
|
Maricopa Community College District • Office of
Institutional Effectiveness • Maricopa Trends |
|
|
|
|
|
|
|
|
|
|
|
|
|
|
|
|
|
|
|
|
|
|
|
|
|
|
|
|
|
|
|
|
|
|
|
|
|
|
|
|
|
|
|
|
|
|
|
|
|
|
|
|
|
|
|
|
|
|
|
|
|
|
|
|
|
|
|
|
|
|
|
|
|
|
|
|
|
|
|
|
|
|
|
|
|
|
|
|
|
|
|
|
|
|
|
|
|
|
|
|
|
|
|
|
|
|
|
|
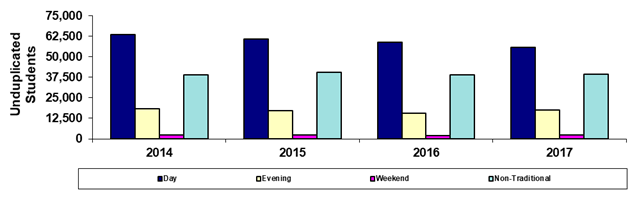
Maricopa County Community College District |
|
|
|
|
|
|
Fall 45th Day Headcount by Primary Time of
Attendance |
|
|
|
|
|
|
District-wide Unduplicated Total |
|
|
|
|
|
|
(Each student is counted only once) |
|
|
|
|
|
|
|
|
|
|
|
|
|
|
|
|
|
|
|
|
|
|
|
|
|
|
|
|
|
|
|
|
|
|
|
|
|
|
|
|
|
|
|
|
|
|
|
|
|
|
|
|
|
|
|
|
|
|
|
|
|
|
|
|
|
|
|
|
|
|
|
|
|
|
|
|
|
|
|
|
|
|
|
|
|
|
|
|
|
|
|
|
|
|
|
|
Year |
2014 |
2015 |
2016 |
2017 |
|
|
|
|
|
|
|
|
|
|
|
|
Day |
63,587 |
60,849 |
59,079 |
55,804 |
|
|
|
|
|
|
|
|
|
|
|
|
Evening |
18,442 |
17,282 |
15,748 |
17,542 |
|
|
|
|
|
|
|
|
|
|
|
|
Weekend |
2,368 |
2,265 |
2,037 |
2,322 |
|
|
|
|
|
|
|
|
|
|
|
|
Non-Traditional |
38,866 |
40,650 |
38,955 |
39,545 |
|
|
|
|
|
|
|
|
|
|
|
|
Unduplicated Total |
123,263 |
121,046 |
115,819 |
115,213 |
|
|
|
|
|
|
|
|
|
|
|
|
|
|
|
|
|
|
|
|
|
|
|
|
|
|
|
|
|
% Day |
51.6% |
50.3% |
51.0% |
48.4% |
|
|
|
|
|
|
|
|
|
|
|
|
% Evening |
15.0% |
14.3% |
13.6% |
15.2% |
|
|
|
|
|
|
|
|
|
|
|
|
%Weekend |
1.9% |
1.9% |
1.8% |
2.0% |
|
|
|
|
|
|
|
|
|
|
|
|
%Non-Traditional |
31.5% |
33.6% |
33.6% |
34.3% |
|
|
|
|
|
|
|
|
|
|
|
|
|
|
|
|
|
|
|
|
|
|
|
|
|
|
|
|
|
Print in landscape for best results |
Last updated on |
September 24, 2018 |
|
|
|
|
|
|
Source:
Official 45th Day headcount as reported by colleges. |
|
|
|
|
|
|
Maricopa Community College District • Office of
Institutional Effectiveness • Maricopa Trends |
|
|
|
|
|
|
|
|
|
|
|
|
|
|
|
|
|
|
|
|
|
|