|
|
|
|
|
|
|
|
|
|
|
|
|
|
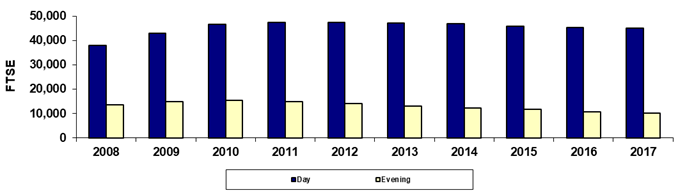
Maricopa County Community College District |
|
|
Fall 45th Day Day/Evening FTSE |
|
|
|
|
|
|
|
|
|
|
|
|
|
|
|
|
|
|
|
|
|
|
|
|
|
|
|
|
|
|
|
|
|
|
|
|
|
|
|
|
|
|
|
|
|
|
|
|
|
|
|
|
|
|
|
|
|
|
|
|
|
|
|
|
|
|
|
|
|
|
|
|
|
|
|
|
|
|
|
|
|
|
|
|
|
|
|
|
|
|
|
|
|
|
|
|
|
|
|
|
|
|
|
|
|
|
|
|
|
|
|
|
|
|
|
|
|
|
|
|
|
|
|
|
|
|
|
|
|
|
|
|
|
|
|
|
|
|
|
|
|
|
|
|
|
|
|
|
|
|
|
|
|
|
|
|
|
|
Year |
2008 |
2009 |
2010 |
2011 |
2012 |
2013 |
2014 |
2015 |
2016 |
2017 |
|
|
Day |
38,055.2 |
42,879.4 |
46,466.3 |
47,425.5 |
47,454.1 |
47,150.5 |
46,834.9 |
45,843.4 |
45,259.6 |
44,981.3 |
|
|
Evening |
13,663.2 |
14,791.3 |
15,458.0 |
14,883.5 |
14,031.2 |
12,992.2 |
12,214.1 |
11,705.3 |
10,774.0 |
10,180.8 |
|
|
Total |
51,718.5 |
57,670.7 |
61,924.3 |
62,309.0 |
61,485.3 |
60,144.0 |
59,049.0 |
57,548.8 |
56,033.6 |
55,162.1 |
|
|
|
|
|
|
|
|
|
|
|
|
|
|
|
% Day |
73.6% |
74.4% |
75.0% |
76.1% |
77.2% |
78.4% |
79.3% |
79.7% |
80.8% |
81.5% |
|
|
% Evening |
26.4% |
25.6% |
25.0% |
23.9% |
22.8% |
21.6% |
20.7% |
20.3% |
19.2% |
18.5% |
|
|
|
|
|
|
|
|
|
|
|
|
|
|
|
Due to rounding, the sum of the numbers may not
equal the Total. |
|
|
Print in landscape for best results |
Last updated on |
September 24, 2018 |
|
|
Source:
Offical 45th Day FTSE numbers as reported by the colleges after manual
adjustments (unaudited). |
|
|
Maricopa Community College District • Office of
Institutional Effectiveness • Maricopa Trends |
|
|
|
|
|
|
|
|
|
|
|
|
|
|