|
|
|
|
|
|
|
|
|
|
|
|
|
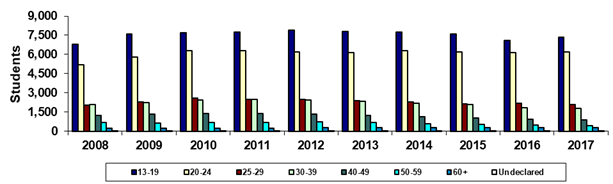
Glendale Community College |
|
Fall 45th Day Age Groups |
|
|
|
|
|
|
|
|
|
|
|
|
|
|
|
|
|
|
|
|
|
|
|
|
|
Year |
2008 |
2009 |
2010 |
2011 |
2012 |
2013 |
2014 |
2015 |
2016 |
2017 |
|
13-19 |
6,798 |
7,575 |
7,720 |
7,728 |
7,892 |
7,784 |
7,760 |
7,573 |
7,102 |
7,363 |
|
20-24 |
5,174 |
5,813 |
6,296 |
6,309 |
6,180 |
6,146 |
6,304 |
6,202 |
6,160 |
6,184 |
|
25-29 |
2,023 |
2,300 |
2,598 |
2,499 |
2,511 |
2,373 |
2,283 |
2,159 |
2,165 |
2,106 |
|
30-39 |
2,092 |
2,224 |
2,453 |
2,505 |
2,451 |
2,339 |
2,168 |
2,078 |
1,843 |
1,793 |
|
40-49 |
1,213 |
1,332 |
1,383 |
1,388 |
1,342 |
1,240 |
1,113 |
1,053 |
953 |
863 |
|
50-59 |
666 |
657 |
663 |
688 |
712 |
697 |
608 |
540 |
509 |
449 |
|
60+ |
253 |
248 |
257 |
255 |
269 |
288 |
266 |
264 |
262 |
271 |
|
Undeclared |
9 |
5 |
3 |
4 |
4 |
5 |
4 |
2 |
6 |
4 |
|
Sum of Colleges* |
18,228 |
20,154 |
21,373 |
21,376 |
21,361 |
20,872 |
20,506 |
19,871 |
19,000 |
19,033 |
|
|
|
|
|
|
|
|
|
|
|
|
|
% 13-19 |
37.3% |
37.6% |
36.1% |
36.2% |
36.9% |
37.3% |
37.8% |
38.1% |
37.4% |
38.7% |
|
% 20-24 |
28.4% |
28.8% |
29.5% |
29.5% |
28.9% |
29.4% |
30.7% |
31.2% |
32.4% |
32.5% |
|
% 25-29 |
11.1% |
11.4% |
12.2% |
11.7% |
11.8% |
11.4% |
11.1% |
10.9% |
11.4% |
11.1% |
|
% 30-39 |
11.5% |
11.0% |
11.5% |
11.7% |
11.5% |
11.2% |
10.6% |
10.5% |
9.7% |
9.4% |
|
% 40-49 |
6.7% |
6.6% |
6.5% |
6.5% |
6.3% |
5.9% |
5.4% |
5.3% |
5.0% |
4.5% |
|
% 50-59 |
3.7% |
3.3% |
3.1% |
3.2% |
3.3% |
3.3% |
3.0% |
2.7% |
2.7% |
2.4% |
|
% 60+ |
1.4% |
1.2% |
1.2% |
1.2% |
1.3% |
1.4% |
1.3% |
1.3% |
1.4% |
1.4% |
|
% Undeclared |
0.0% |
0.0% |
0.0% |
0.0% |
0.0% |
0.0% |
0.0% |
0.0% |
0.0% |
0.0% |
|
|
|
|
|
|
|
|
|
|
|
|
|
Print in landscape for best results |
Last updated on |
September 24, 2018 |
|
Source:
Official 45th Day headcount as reported by colleges. |
|
Maricopa Community College District • Office of
Institutional Effectiveness • Maricopa Trends |
|
|
|
|
|
|
|
|
|
|
|
|