|
|
|
|
|
|
|
|
|
|
|
|
|
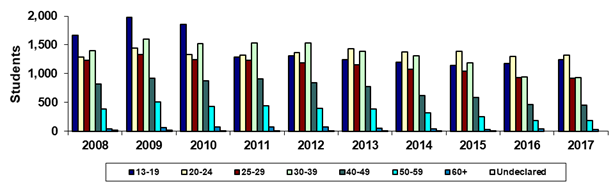
GateWay Community College |
|
Fall 45th Day Age Groups |
|
|
|
|
|
|
|
|
|
|
|
|
|
|
|
|
|
|
|
|
|
|
|
|
|
Year |
2008 |
2009 |
2010 |
2011 |
2012 |
2013 |
2014 |
2015 |
2016 |
2017 |
|
13-19 |
1,665 |
1,973 |
1,856 |
1,283 |
1,309 |
1,248 |
1,202 |
1,140 |
1,181 |
1,246 |
|
20-24 |
1,284 |
1,441 |
1,337 |
1,318 |
1,368 |
1,431 |
1,380 |
1,388 |
1,303 |
1,323 |
|
25-29 |
1,227 |
1,334 |
1,242 |
1,229 |
1,191 |
1,154 |
1,080 |
1,041 |
934 |
915 |
|
30-39 |
1,399 |
1,596 |
1,524 |
1,533 |
1,537 |
1,386 |
1,308 |
1,186 |
947 |
930 |
|
40-49 |
823 |
920 |
874 |
906 |
839 |
776 |
616 |
590 |
464 |
450 |
|
50-59 |
388 |
510 |
431 |
447 |
399 |
391 |
316 |
253 |
188 |
189 |
|
60+ |
45 |
66 |
70 |
75 |
70 |
49 |
46 |
34 |
41 |
34 |
|
Undeclared |
22 |
23 |
12 |
10 |
7 |
5 |
2 |
5 |
0 |
0 |
|
Sum of Colleges* |
6,853 |
7,863 |
7,346 |
6,801 |
6,720 |
6,440 |
5,950 |
5,637 |
5,058 |
5,087 |
|
|
|
|
|
|
|
|
|
|
|
|
|
% 13-19 |
24.3% |
25.1% |
25.3% |
18.9% |
19.5% |
19.4% |
20.2% |
20.2% |
23.3% |
24.5% |
|
% 20-24 |
18.7% |
18.3% |
18.2% |
19.4% |
20.4% |
22.2% |
23.2% |
24.6% |
25.8% |
26.0% |
|
% 25-29 |
17.9% |
17.0% |
16.9% |
18.1% |
17.7% |
17.9% |
18.2% |
18.5% |
18.5% |
18.0% |
|
% 30-39 |
20.4% |
20.3% |
20.7% |
22.5% |
22.9% |
21.5% |
22.0% |
21.0% |
18.7% |
18.3% |
|
% 40-49 |
12.0% |
11.7% |
11.9% |
13.3% |
12.5% |
12.0% |
10.4% |
10.5% |
9.2% |
8.8% |
|
% 50-59 |
5.7% |
6.5% |
5.9% |
6.6% |
5.9% |
6.1% |
5.3% |
4.5% |
3.7% |
3.7% |
|
% 60+ |
0.7% |
0.8% |
1.0% |
1.1% |
1.0% |
0.8% |
0.8% |
0.6% |
0.8% |
0.7% |
|
% Undeclared |
0.3% |
0.3% |
0.2% |
0.1% |
0.1% |
0.1% |
0.0% |
0.1% |
0.0% |
0.0% |
|
|
|
|
|
|
|
|
|
|
|
|
|
Print in landscape for best results |
Last updated on |
September 24, 2018 |
|
Source:
Official 45th Day headcount as reported by colleges. |
|
Maricopa Community College District • Office of
Institutional Effectiveness • Maricopa Trends |
|
|
|
|
|
|
|
|
|
|
|
|