|
|
|
|
|
|
|
|
|
|
|
|
|
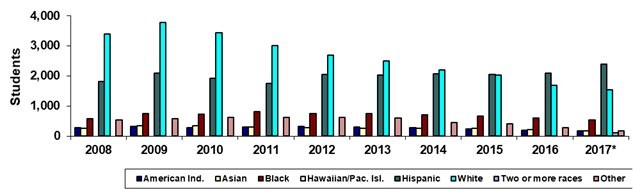
GateWay Community College |
|
Fall 45th Day Ethnicity |
|
|
|
|
|
|
|
|
|
|
|
|
|
|
Year |
2008 |
2009 |
2010 |
2011 |
2012 |
2013 |
2014 |
2015 |
2016 |
2017* |
|
American Ind. |
277 |
322 |
284 |
300 |
329 |
298 |
281 |
237 |
187 |
166 |
|
Asian |
256 |
333 |
343 |
296 |
276 |
259 |
254 |
248 |
211 |
181 |
|
Black |
580 |
750 |
737 |
808 |
748 |
750 |
705 |
653 |
602 |
525 |
|
Hawaiian/Pac. Isl. |
0 |
0 |
0 |
0 |
0 |
0 |
0 |
0 |
0 |
14 |
|
Hispanic |
1,821 |
2,099 |
1,921 |
1,761 |
2,051 |
2,038 |
2,067 |
2,059 |
2,085 |
2,397 |
|
White |
3,389 |
3,773 |
3,438 |
3,006 |
2,700 |
2,503 |
2,192 |
2,032 |
1,695 |
1,531 |
|
Two or more races |
0 |
0 |
0 |
0 |
0 |
0 |
0 |
0 |
0 |
111 |
|
Other |
530 |
586 |
623 |
630 |
616 |
592 |
451 |
408 |
278 |
162 |
|
Total |
6,853 |
7,863 |
7,346 |
6,801 |
6,720 |
6,440 |
5,950 |
5,637 |
5,058 |
5,087 |
|
|
|
|
|
|
|
|
|
|
|
|
|
% American Ind. |
4.0% |
4.1% |
3.9% |
4.4% |
4.9% |
4.6% |
4.7% |
4.2% |
3.7% |
3.3% |
|
% Asian |
3.7% |
4.2% |
4.7% |
4.4% |
4.1% |
4.0% |
4.3% |
4.4% |
4.2% |
3.6% |
|
% Black |
8.5% |
9.5% |
10.0% |
11.9% |
11.1% |
11.6% |
11.8% |
11.6% |
11.9% |
10.3% |
|
% Hawaiian/Pac. Isl. |
0.0% |
0.0% |
0.0% |
0.0% |
0.0% |
0.0% |
0.0% |
0.0% |
0.0% |
0.3% |
|
% Hispanic |
26.6% |
26.7% |
26.2% |
25.9% |
30.5% |
31.6% |
34.7% |
36.5% |
41.2% |
47.1% |
|
% White |
49.5% |
48.0% |
46.8% |
44.2% |
40.2% |
38.9% |
36.8% |
36.0% |
33.5% |
30.1% |
|
%Two or more races |
0.0% |
0.0% |
0.0% |
0.0% |
0.0% |
0.0% |
0.0% |
0.0% |
0.0% |
2.2% |
|
% Other |
7.7% |
7.5% |
8.5% |
9.3% |
9.2% |
9.2% |
7.6% |
7.2% |
5.5% |
3.2% |
|
|
|
|
|
|
|
|
|
|
|
|
|
Print in landscape for best results |
Last updated on |
September 24, 2018 |
|
Source:
Official 45th Day headcount as reported by colleges. |
|
Maricopa Community College District • Office of
Institutional Effectiveness • Maricopa Trends |
|
*Beginning in Fall 2017, race-ethnicity categories
changed to provide counts for "Hawaiian/Pacific Islander" and
"Two or more races." |
|
|
|
|
|
|
|
|
|
|
|
|
|
|
|
|
|
|
|
|
|
|
|
|