|
|
|
|
|
|
|
|
|
|
|
|
|
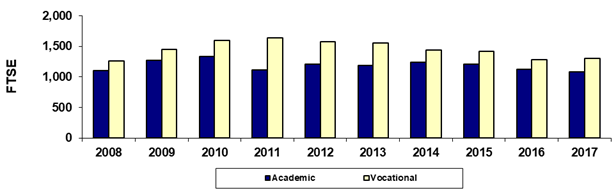
GateWay Community College |
|
Fall 45th Day Academic/Vocational FTSE |
|
|
|
|
|
|
|
|
|
|
|
|
|
|
Year |
2008 |
2009 |
2010 |
2011 |
2012 |
2013 |
2014 |
2015 |
2016 |
2017 |
|
Academic |
1,101.5 |
1,267.7 |
1,332.4 |
1,111.2 |
1,212.9 |
1,191.9 |
1,240.7 |
1,210.2 |
1,120.3 |
1,086.8 |
|
Vocational |
1,263.2 |
1,447.6 |
1,598.3 |
1,635.6 |
1,575.7 |
1,557.3 |
1,437.8 |
1,414.2 |
1,284.4 |
1,307.9 |
|
Total |
2,364.7 |
2,715.3 |
2,930.7 |
2,746.8 |
2,788.7 |
2,749.1 |
2,678.4 |
2,624.4 |
2,404.7 |
2,394.7 |
|
|
|
|
|
|
|
|
|
|
|
|
|
% Academic |
46.6% |
46.7% |
45.5% |
40.5% |
43.5% |
43.4% |
46.3% |
46.1% |
46.6% |
45.4% |
|
% Vocational |
53.4% |
53.3% |
54.5% |
59.5% |
56.5% |
56.6% |
53.7% |
53.9% |
53.4% |
54.6% |
|
|
|
|
|
|
|
|
|
|
|
|
|
Due to rounding, the sum of the numbers may not
equal the Total. |
|
Print in landscape for best results |
Last updated on |
September 24, 2018 |
|
Source:
Offical 45th Day FTSE numbers as reported by the colleges after manual
adjustments (unaudited). |
|
Maricopa Community College District • Office of
Institutional Effectiveness • Maricopa Trends |
|
|
|
|
|
|
|
|
|
|
|
|