|
|
|
|
|
|
|
|
|
|
|
|
|
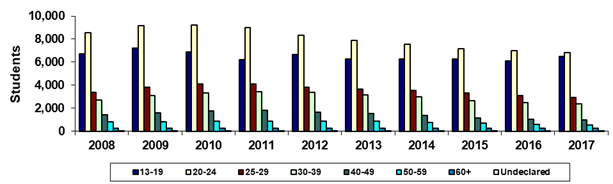
Mesa Community College |
|
Fall 45th Day Age Groups |
|
|
|
|
|
|
|
|
|
|
|
|
|
|
|
|
|
|
|
|
|
|
|
|
|
Year |
2008 |
2009 |
2010 |
2011 |
2012 |
2013 |
2014 |
2015 |
2016 |
2017 |
|
13-19 |
6,720 |
7,191 |
6,859 |
6,233 |
6,646 |
6,294 |
6,257 |
6,295 |
6,081 |
6,506 |
|
20-24 |
8,564 |
9,188 |
9,221 |
8,993 |
8,346 |
7,877 |
7,531 |
7,149 |
6,987 |
6,848 |
|
25-29 |
3,356 |
3,827 |
4,095 |
4,105 |
3,820 |
3,656 |
3,541 |
3,298 |
3,078 |
2,934 |
|
30-39 |
2,712 |
3,107 |
3,348 |
3,452 |
3,391 |
3,140 |
2,973 |
2,627 |
2,477 |
2,350 |
|
40-49 |
1,407 |
1,569 |
1,738 |
1,792 |
1,660 |
1,556 |
1,365 |
1,175 |
1,053 |
964 |
|
50-59 |
797 |
798 |
894 |
863 |
889 |
868 |
772 |
698 |
586 |
538 |
|
60+ |
247 |
259 |
239 |
250 |
260 |
276 |
260 |
243 |
239 |
277 |
|
Undeclared |
22 |
21 |
14 |
7 |
12 |
11 |
12 |
6 |
7 |
7 |
|
Sum of Colleges* |
23,825 |
25,960 |
26,408 |
25,695 |
25,024 |
23,678 |
22,711 |
21,491 |
20,508 |
20,424 |
|
|
|
|
|
|
|
|
|
|
|
|
|
% 13-19 |
28.2% |
27.7% |
26.0% |
24.3% |
26.6% |
26.6% |
27.6% |
29.3% |
29.7% |
31.9% |
|
% 20-24 |
35.9% |
35.4% |
34.9% |
35.0% |
33.4% |
33.3% |
33.2% |
33.3% |
34.1% |
33.5% |
|
% 25-29 |
14.1% |
14.7% |
15.5% |
16.0% |
15.3% |
15.4% |
15.6% |
15.3% |
15.0% |
14.4% |
|
% 30-39 |
11.4% |
12.0% |
12.7% |
13.4% |
13.6% |
13.3% |
13.1% |
12.2% |
12.1% |
11.5% |
|
% 40-49 |
5.9% |
6.0% |
6.6% |
7.0% |
6.6% |
6.6% |
6.0% |
5.5% |
5.1% |
4.7% |
|
% 50-59 |
3.3% |
3.1% |
3.4% |
3.4% |
3.6% |
3.7% |
3.4% |
3.2% |
2.9% |
2.6% |
|
% 60+ |
1.0% |
1.0% |
0.9% |
1.0% |
1.0% |
1.2% |
1.1% |
1.1% |
1.2% |
1.4% |
|
% Undeclared |
0.1% |
0.1% |
0.1% |
0.0% |
0.0% |
0.0% |
0.1% |
0.0% |
0.0% |
0.0% |
|
|
|
|
|
|
|
|
|
|
|
|
|
Print in landscape for best results |
Last updated on |
September 24, 2018 |
|
Source:
Official 45th Day headcount as reported by colleges. |
|
Maricopa Community College District • Office of
Institutional Effectiveness • Maricopa Trends |
|
|
|
|
|
|
|
|
|
|
|
|