|
|
|
|
|
|
|
|
|
|
|
|
|
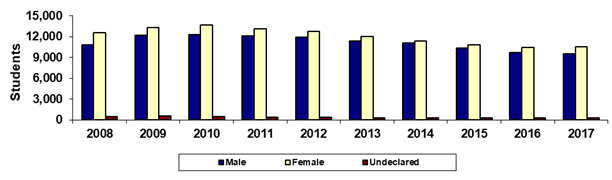
Mesa Community College |
|
Fall 45th Day Gender |
|
|
|
|
|
|
|
|
|
|
|
|
|
|
|
|
|
|
|
|
|
|
|
|
|
Year |
2008 |
2009 |
2010 |
2011 |
2012 |
2013 |
2014 |
2015 |
2016 |
2017 |
|
Male |
10,816 |
12,175 |
12,300 |
12,138 |
11,870 |
11,355 |
11,050 |
10,371 |
9,722 |
9,549 |
|
Female |
12,543 |
13,266 |
13,674 |
13,144 |
12,769 |
12,016 |
11,366 |
10,836 |
10,467 |
10,551 |
|
Undeclared |
466 |
519 |
434 |
413 |
385 |
307 |
295 |
284 |
319 |
324 |
|
Total |
23,825 |
25,960 |
26,408 |
25,695 |
25,024 |
23,678 |
22,711 |
21,491 |
20,508 |
20,424 |
|
|
|
% Male |
45.4% |
46.9% |
46.6% |
47.2% |
47.4% |
48.0% |
48.7% |
48.3% |
47.4% |
46.8% |
|
% Female |
52.6% |
51.1% |
51.8% |
51.2% |
51.0% |
50.7% |
50.0% |
50.4% |
51.0% |
51.7% |
|
% Undeclared |
2.0% |
2.0% |
1.6% |
1.6% |
1.5% |
1.3% |
1.3% |
1.3% |
1.6% |
1.6% |
|
|
|
|
|
|
|
|
|
|
|
|
|
Print in landscape for best results |
Last updated on |
September 24, 2018 |
|
Source:
Official 45th Day headcount as reported by colleges. |
|
Maricopa Community College District • Office of
Institutional Effectiveness • Maricopa Trends |
|
|
|
|
|
|
|
|
|
|
|
|