|
|
|
|
|
|
|
|
|
|
|
|
|
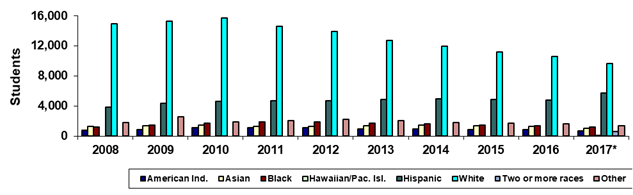
Mesa Community College |
|
Fall 45th Day Ethnicity |
|
|
|
|
|
|
|
|
|
|
|
|
|
|
Year |
2008 |
2009 |
2010 |
2011 |
2012 |
2013 |
2014 |
2015 |
2016 |
2017* |
|
American Ind. |
812 |
900 |
1,076 |
1,117 |
1,115 |
974 |
963 |
897 |
834 |
718 |
|
Asian |
1,271 |
1,332 |
1,417 |
1,327 |
1,300 |
1,364 |
1,465 |
1,358 |
1,287 |
1,039 |
|
Black |
1,199 |
1,469 |
1,713 |
1,917 |
1,872 |
1,744 |
1,614 |
1,468 |
1,379 |
1,196 |
|
Hawaiian/Pac. Isl. |
0 |
0 |
0 |
0 |
0 |
0 |
0 |
0 |
0 |
79 |
|
Hispanic |
3,810 |
4,351 |
4,583 |
4,693 |
4,671 |
4,859 |
4,929 |
4,873 |
4,820 |
5,737 |
|
White |
14,908 |
15,316 |
15,716 |
14,596 |
13,878 |
12,707 |
11,922 |
11,152 |
10,597 |
9,675 |
|
Two or more races |
0 |
0 |
0 |
0 |
0 |
0 |
0 |
0 |
0 |
639 |
|
Other |
1,825 |
2,592 |
1,903 |
2,045 |
2,188 |
2,030 |
1,818 |
1,743 |
1,591 |
1,341 |
|
Total |
23,825 |
25,960 |
26,408 |
25,695 |
25,024 |
23,678 |
22,711 |
21,491 |
20,508 |
20,424 |
|
|
|
|
|
|
|
|
|
|
|
|
|
% American Ind. |
3.4% |
3.5% |
4.1% |
4.3% |
4.5% |
4.1% |
4.2% |
4.2% |
4.1% |
3.5% |
|
% Asian |
5.3% |
5.1% |
5.4% |
5.2% |
5.2% |
5.8% |
6.5% |
6.3% |
6.3% |
5.1% |
|
% Black |
5.0% |
5.7% |
6.5% |
7.5% |
7.5% |
7.4% |
7.1% |
6.8% |
6.7% |
5.9% |
|
% Hawaiian/Pac. Isl. |
0.0% |
0.0% |
0.0% |
0.0% |
0.0% |
0.0% |
0.0% |
0.0% |
0.0% |
0.4% |
|
% Hispanic |
16.0% |
16.8% |
17.4% |
18.3% |
18.7% |
20.5% |
21.7% |
22.7% |
23.5% |
28.1% |
|
% White |
62.6% |
59.0% |
59.5% |
56.8% |
55.5% |
53.7% |
52.5% |
51.9% |
51.7% |
47.4% |
|
%Two or more races |
0.0% |
0.0% |
0.0% |
0.0% |
0.0% |
0.0% |
0.0% |
0.0% |
0.0% |
3.1% |
|
% Other |
7.7% |
10.0% |
7.2% |
8.0% |
8.7% |
8.6% |
8.0% |
8.1% |
7.8% |
6.6% |
|
|
|
|
|
|
|
|
|
|
|
|
|
Print in landscape for best results |
Last updated on |
September 24, 2018 |
|
Source:
Official 45th Day headcount as reported by colleges. |
|
Maricopa Community College District • Office of
Institutional Effectiveness • Maricopa Trends |
|
*Beginning in Fall 2017, race-ethnicity categories
changed to provide counts for "Hawaiian/Pacific Islander" and
"Two or more races." |
|
|
|
|
|
|
|
|
|
|
|
|
|
|
|
|
|
|
|
|
|
|
|
|