|
|
|
|
|
|
|
|
|
|
|
|
|
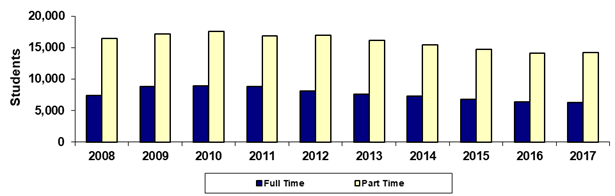
Mesa Community College |
|
Fall 45th Day Academic Load (Full and Part Time) |
|
|
|
|
|
|
|
|
|
|
|
|
|
|
Year |
2008 |
2009 |
2010 |
2011 |
2012 |
2013 |
2014 |
2015 |
2016 |
2017 |
|
Full Time |
7,366 |
8,822 |
8,893 |
8,842 |
8,114 |
7,572 |
7,295 |
6,743 |
6,425 |
6,237 |
|
Part Time |
16,459 |
17,138 |
17,515 |
16,853 |
16,910 |
16,106 |
15,416 |
14,748 |
14,083 |
14,187 |
|
Total |
23,825 |
25,960 |
26,408 |
25,695 |
25,024 |
23,678 |
22,711 |
21,491 |
20,508 |
20,424 |
|
|
|
|
|
|
|
|
|
|
|
|
|
% Full Time |
30.9% |
34.0% |
33.7% |
34.4% |
32.4% |
32.0% |
32.1% |
31.4% |
31.3% |
30.5% |
|
% Part Time |
69.1% |
66.0% |
66.3% |
65.6% |
67.6% |
68.0% |
67.9% |
68.6% |
68.7% |
69.5% |
|
|
|
|
|
|
|
|
|
|
|
|
|
Print in landscape for best results |
Last updated on |
September 24, 2018 |
|
Source:
Official 45th Day headcount as reported by colleges. |
|
Maricopa Community College District • Office of
Institutional Effectiveness • Maricopa Trends |
|
|
|
|
|
|
|
|
|
|
|
|