|
|
|
|
|
|
|
|
|
|
|
|
|
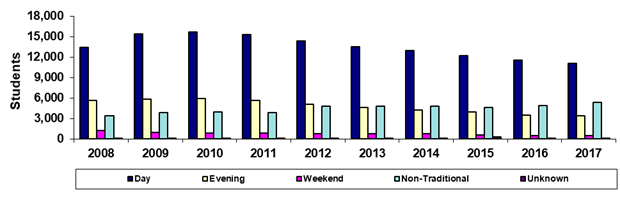
Mesa Community College |
|
Fall 45th Day Headcount by Primary Time of
Attendance |
|
|
|
|
|
|
|
|
|
|
|
|
|
|
Year |
2008 |
2009 |
2010 |
2011 |
2012 |
2013 |
2014 |
2015 |
2016 |
2017 |
|
Day |
13,455 |
15,334 |
15,645 |
15,280 |
14,311 |
13,514 |
12,960 |
12,169 |
11,526 |
11,084 |
|
Evening |
5,638 |
5,859 |
5,921 |
5,631 |
5,075 |
4,584 |
4,186 |
3,939 |
3,529 |
3,405 |
|
Weekend |
1,276 |
943 |
871 |
897 |
803 |
775 |
734 |
557 |
530 |
482 |
|
Non-Traditional |
3,428 |
3,815 |
3,960 |
3,860 |
4,824 |
4,749 |
4,815 |
4,566 |
4,875 |
5,397 |
|
Unknown |
28 |
9 |
11 |
27 |
11 |
56 |
16 |
260 |
48 |
56 |
|
Total |
23,825 |
25,960 |
26,408 |
25,695 |
25,024 |
23,678 |
22,711 |
21,491 |
20,508 |
20,424 |
|
|
|
|
|
|
|
|
|
|
|
|
|
% Day |
56.5% |
59.1% |
59.2% |
59.5% |
57.2% |
57.1% |
57.1% |
56.6% |
56.2% |
54.3% |
|
% Evening |
23.7% |
22.6% |
22.4% |
21.9% |
20.3% |
19.4% |
18.4% |
18.3% |
17.2% |
16.7% |
|
%Weekend |
5.4% |
3.6% |
3.3% |
3.5% |
3.2% |
3.3% |
3.2% |
2.6% |
2.6% |
2.4% |
|
%Non-Traditional |
14.4% |
14.7% |
15.0% |
15.0% |
19.3% |
20.1% |
21.2% |
21.2% |
23.8% |
26.4% |
|
%Unknown |
0.1% |
0.0% |
0.0% |
0.1% |
0.0% |
0.2% |
0.1% |
1.2% |
0.2% |
0.3% |
|
|
|
|
|
|
|
|
|
|
|
|
|
Print in landscape for best results |
Last updated on |
September 24, 2018 |
|
Source:
Official 45th Day headcount as reported by colleges. |
|
Maricopa Community College District • Office of
Institutional Effectiveness • Maricopa Trends |
|
|
|
|
|
|
|
|
|
|
|
|