|
|
|
|
|
|
|
|
|
|
|
|
|
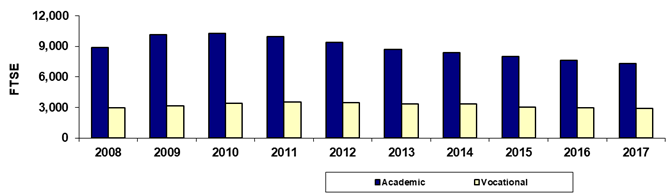
Mesa Community College |
|
Fall 45th Day Academic/Vocational FTSE |
|
|
|
|
|
|
|
|
|
|
|
|
|
|
Year |
2008 |
2009 |
2010 |
2011 |
2012 |
2013 |
2014 |
2015 |
2016 |
2017 |
|
Academic |
8,913.2 |
10,131.1 |
10,271.4 |
9,930.3 |
9,418.4 |
8,706.0 |
8,415.7 |
7,987.1 |
7,610.2 |
7,339.1 |
|
Vocational |
2,967.2 |
3,146.5 |
3,397.1 |
3,512.3 |
3,462.1 |
3,320.1 |
3,322.5 |
3,032.1 |
2,966.1 |
2,908.7 |
|
Total |
11,880.3 |
13,277.5 |
13,668.5 |
13,442.6 |
12,880.5 |
12,026.1 |
11,738.2 |
11,019.2 |
10,576.3 |
10,247.8 |
|
|
|
|
|
|
|
|
|
|
|
|
|
% Academic |
75.0% |
76.3% |
75.1% |
73.9% |
73.1% |
72.4% |
71.7% |
72.5% |
72.0% |
71.6% |
|
% Occupational |
25.0% |
23.7% |
24.9% |
26.1% |
26.9% |
27.6% |
28.3% |
27.5% |
28.0% |
28.4% |
|
|
|
|
|
|
|
|
|
|
|
|
|
Due to rounding, the sum of the numbers may not
equal the Total. |
|
Print in landscape for best results |
Last updated on |
September 24, 2018 |
|
Source:
Offical 45th Day FTSE numbers as reported by the colleges after manual
adjustments (unaudited). |
|
Maricopa Community College District • Office of
Institutional Effectiveness • Maricopa Trends |
|
|
|
|
|
|
|
|
|
|
|
|