|
|
|
|
|
|
|
|
|
|
|
|
|
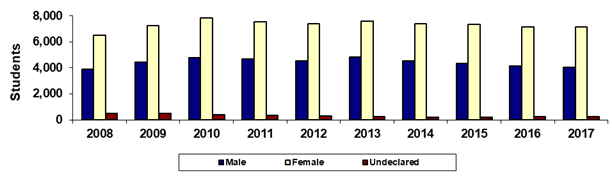
Phoenix College |
|
Fall 45th Day Gender |
|
|
|
|
|
|
|
|
|
|
|
|
|
|
|
|
|
|
|
|
|
|
|
|
|
Year |
2008 |
2009 |
2010 |
2011 |
2012 |
2013 |
2014 |
2015 |
2016 |
2017 |
|
Male |
3,873 |
4,451 |
4,779 |
4,675 |
4,551 |
4,851 |
4,515 |
4,315 |
4,147 |
4,046 |
|
Female |
6,525 |
7,234 |
7,821 |
7,523 |
7,403 |
7,586 |
7,386 |
7,354 |
7,125 |
7,155 |
|
Undeclared |
519 |
479 |
400 |
367 |
274 |
239 |
206 |
196 |
236 |
227 |
|
Total |
10,917 |
12,164 |
13,000 |
12,565 |
12,228 |
12,676 |
12,107 |
11,865 |
11,508 |
11,428 |
|
|
|
% Male |
35.5% |
36.6% |
36.8% |
37.2% |
37.2% |
38.3% |
37.3% |
36.4% |
36.0% |
35.4% |
|
% Female |
59.8% |
59.5% |
60.2% |
59.9% |
60.5% |
59.8% |
61.0% |
62.0% |
61.9% |
62.6% |
|
% Undeclared |
4.8% |
3.9% |
3.1% |
2.9% |
2.2% |
1.9% |
1.7% |
1.7% |
2.1% |
2.0% |
|
|
|
|
|
|
|
|
|
|
|
|
|
Print in landscape for best results |
Last updated on |
September 24, 2018 |
|
Source:
Official 45th Day headcount as reported by colleges. |
|
Maricopa Community College District • Office of
Institutional Effectiveness • Maricopa Trends |
|
|
|
|
|
|
|
|
|
|
|
|