|
|
|
|
|
|
|
|
|
|
|
|
|
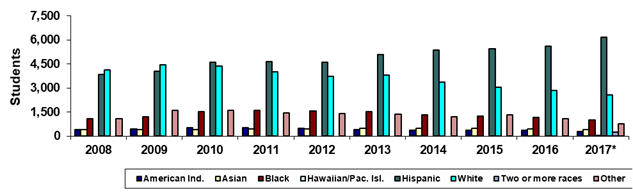
Phoenix College |
|
Fall 45th Day Ethnicity |
|
|
|
|
|
|
|
|
|
|
|
|
|
|
Year |
2008 |
2009 |
2010 |
2011 |
2012 |
2013 |
2014 |
2015 |
2016 |
2017* |
|
American Ind. |
401 |
460 |
503 |
506 |
464 |
411 |
378 |
354 |
353 |
271 |
|
Asian |
394 |
402 |
406 |
432 |
461 |
473 |
478 |
478 |
436 |
403 |
|
Black |
1,069 |
1,214 |
1,507 |
1,583 |
1,569 |
1,541 |
1,333 |
1,234 |
1,181 |
1,010 |
|
Hawaiian/Pac. Isl. |
0 |
0 |
0 |
0 |
0 |
0 |
0 |
0 |
0 |
28 |
|
Hispanic |
3,836 |
4,037 |
4,614 |
4,633 |
4,615 |
5,099 |
5,346 |
5,433 |
5,614 |
6,165 |
|
White |
4,132 |
4,439 |
4,369 |
3,988 |
3,715 |
3,803 |
3,350 |
3,055 |
2,834 |
2,577 |
|
Two or more races |
0 |
0 |
0 |
0 |
0 |
0 |
0 |
0 |
0 |
225 |
|
Other |
1,085 |
1,612 |
1,601 |
1,423 |
1,404 |
1,349 |
1,222 |
1,311 |
1,090 |
749 |
|
Total |
10,917 |
12,164 |
13,000 |
12,565 |
12,228 |
12,676 |
12,107 |
11,865 |
11,508 |
11,428 |
|
|
|
|
|
|
|
|
|
|
|
|
|
% American Ind. |
3.7% |
3.8% |
3.9% |
4.0% |
3.8% |
3.2% |
3.1% |
3.0% |
3.1% |
2.4% |
|
% Asian |
3.6% |
3.3% |
3.1% |
3.4% |
3.8% |
3.7% |
3.9% |
4.0% |
3.8% |
3.5% |
|
% Black |
9.8% |
10.0% |
11.6% |
12.6% |
12.8% |
12.2% |
11.0% |
10.4% |
10.3% |
8.8% |
|
% Hawaiian/Pac. Isl. |
0.0% |
0.0% |
0.0% |
0.0% |
0.0% |
0.0% |
0.0% |
0.0% |
0.0% |
0.2% |
|
% Hispanic |
35.1% |
33.2% |
35.5% |
36.9% |
37.7% |
40.2% |
44.2% |
45.8% |
48.8% |
53.9% |
|
% White |
37.8% |
36.5% |
33.6% |
31.7% |
30.4% |
30.0% |
27.7% |
25.7% |
24.6% |
22.5% |
|
%Two or more races |
0.0% |
0.0% |
0.0% |
0.0% |
0.0% |
0.0% |
0.0% |
0.0% |
0.0% |
2.0% |
|
% Other |
9.9% |
13.3% |
12.3% |
11.3% |
11.5% |
10.6% |
10.1% |
11.0% |
9.5% |
6.6% |
|
|
|
|
|
|
|
|
|
|
|
|
|
Print in landscape for best results |
Last updated on |
September 24, 2018 |
|
Source:
Official 45th Day headcount as reported by colleges. |
|
Maricopa Community College District • Office of
Institutional Effectiveness • Maricopa Trends |
|
*Beginning in Fall 2017, race-ethnicity categories
changed to provide counts for "Hawaiian/Pacific Islander" and
"Two or more races." |
|
|
|
|
|
|
|
|
|
|
|
|
|
|
|
|
|
|
|
|
|
|
|
|