|
|
|
|
|
|
|
|
|
|
|
|
|
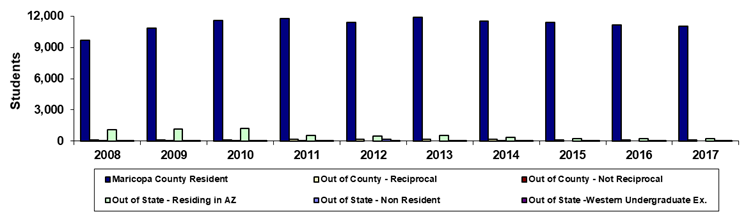
Phoenix College |
|
|
|
|
|
|
|
|
|
|
|
|
|
|
|
|
|
|
|
|
|
|
|
|
|
|
|
|
|
|
|
|
|
|
|
|
|
|
|
|
|
|
|
|
|
|
|
|
|
|
|
|
|
|
|
|
|
|
|
|
|
|
|
|
|
|
|
|
|
|
|
|
|
|
|
|
|
|
|
|
|
|
|
|
|
|
|
|
|
|
|
|
|
|
|
|
|
|
|
|
|
|
|
|
|
|
|
|
|
|
|
|
|
|
|
|
|
|
|
|
|
|
|
|
|
|
|
|
|
|
|
|
|
|
|
|
|
|
|
|
|
|
|
|
|
|
|
Year |
2008 |
2009 |
2010 |
2011 |
2012 |
2013 |
2014 |
2015 |
2016 |
2017 |
|
Maricopa County Resident |
9,687 |
10,858 |
11,618 |
11,793 |
11,405 |
11,875 |
11,536 |
11,412 |
11,150 |
11,019 |
|
Out of County - Reciprocal |
88 |
92 |
105 |
149 |
161 |
164 |
151 |
126 |
79 |
101 |
|
Out of County - Not Reciprocal |
6 |
1 |
5 |
1 |
0 |
0 |
1 |
0 |
0 |
0 |
|
Out of State - Residing in AZ |
1,072 |
1,172 |
1,199 |
554 |
451 |
540 |
349 |
258 |
234 |
249 |
|
Out of State - Non Resident |
45 |
27 |
48 |
37 |
183 |
58 |
25 |
20 |
13 |
15 |
|
Out of State -Western Undergraduate Ex. |
19 |
14 |
25 |
31 |
28 |
39 |
45 |
49 |
32 |
44 |
|
Total |
10,917 |
12,164 |
13,000 |
12,565 |
12,228 |
12,676 |
12,107 |
11,865 |
11,508 |
11,428 |
|
|
|
|
|
|
|
|
|
|
|
|
|
%Maricopa County Resident |
88.7% |
89.3% |
89.4% |
93.9% |
93.3% |
93.7% |
95.3% |
96.2% |
96.9% |
96.4% |
|
%Out of County - Reciprocal |
0.8% |
0.8% |
0.8% |
1.2% |
1.3% |
1.3% |
1.2% |
1.1% |
0.7% |
0.9% |
|
%Out of County - Not Reciprocal |
0.1% |
0.0% |
0.0% |
0.0% |
0.0% |
0.0% |
0.0% |
0.0% |
0.0% |
0.0% |
|
%Out of State - Residing in AZ |
9.8% |
9.6% |
9.2% |
4.4% |
3.7% |
4.3% |
2.9% |
2.2% |
2.0% |
2.2% |
|
%Out of State - Non Resident |
0.4% |
0.2% |
0.4% |
0.3% |
1.5% |
0.5% |
0.2% |
0.2% |
0.1% |
0.1% |
|
%Out of State -Western Undergraduate Ex. |
0.2% |
0.1% |
0.2% |
0.2% |
0.2% |
0.3% |
0.4% |
0.4% |
0.3% |
0.4% |
|
|
|
|
|
|
|
|
|
|
|
|
|
Print in landscape for best results |
Last updated on |
September 24, 2018 |
|
Source:
Official 45th Day headcount as reported by colleges. |
|
Maricopa Community College District • Office of
Institutional Effectiveness • Maricopa Trends |
|
|
|
|
|
|
|
|
|
|
|
|