|
|
|
|
|
|
|
|
|
|
|
|
|
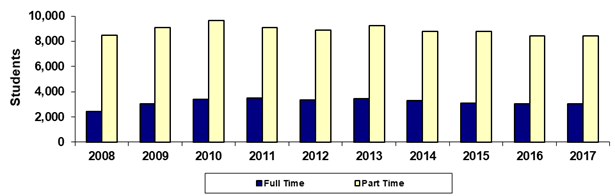
Phoenix College |
|
Fall 45th Day Academic Load (Full and Part Time) |
|
|
|
|
|
|
|
|
|
|
|
|
|
|
Year |
2008 |
2009 |
2010 |
2011 |
2012 |
2013 |
2014 |
2015 |
2016 |
2017 |
|
Full Time |
2,423 |
3,054 |
3,375 |
3,491 |
3,354 |
3,429 |
3,307 |
3,091 |
3,058 |
3,018 |
|
Part Time |
8,494 |
9,110 |
9,625 |
9,074 |
8,874 |
9,247 |
8,800 |
8,774 |
8,450 |
8,410 |
|
Total |
10,917 |
12,164 |
13,000 |
12,565 |
12,228 |
12,676 |
12,107 |
11,865 |
11,508 |
11,428 |
|
|
|
|
|
|
|
|
|
|
|
|
|
% Full Time |
22.2% |
25.1% |
26.0% |
27.8% |
27.4% |
27.1% |
27.3% |
26.1% |
26.6% |
26.4% |
|
% Part Time |
77.8% |
74.9% |
74.0% |
72.2% |
72.6% |
72.9% |
72.7% |
73.9% |
73.4% |
73.6% |
|
|
|
|
|
|
|
|
|
|
|
|
|
Print in landscape for best results |
Last updated on |
September 24, 2018 |
|
Source:
Official 45th Day headcount as reported by colleges. |
|
Maricopa Community College District • Office of
Institutional Effectiveness • Maricopa Trends |
|
|
|
|
|
|
|
|
|
|
|
|