|
|
|
|
|
|
|
|
|
|
|
|
|
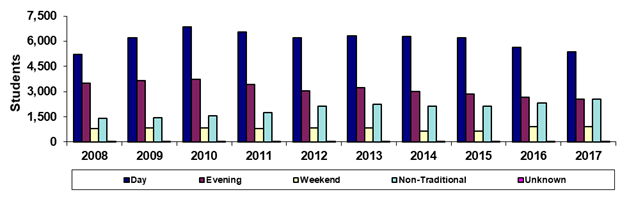
Phoenix College |
|
Fall 45th Day Headcount by Primary Time of
Attendance |
|
|
|
|
|
|
|
|
|
|
|
|
|
|
Year |
2008 |
2009 |
2010 |
2011 |
2012 |
2013 |
2014 |
2015 |
2016 |
2017 |
|
Day |
5,198 |
6,216 |
6,862 |
6,560 |
6,187 |
6,336 |
6,281 |
6,204 |
5,620 |
5,378 |
|
Evening |
3,507 |
3,649 |
3,730 |
3,425 |
3,052 |
3,221 |
2,993 |
2,844 |
2,658 |
2,531 |
|
Weekend |
788 |
832 |
833 |
812 |
822 |
841 |
661 |
628 |
892 |
922 |
|
Non-Traditional |
1,408 |
1,443 |
1,556 |
1,755 |
2,119 |
2,227 |
2,133 |
2,147 |
2,307 |
2,563 |
|
Unknown |
16 |
24 |
19 |
13 |
48 |
51 |
39 |
42 |
31 |
34 |
|
Total |
10,917 |
12,164 |
13,000 |
12,565 |
12,228 |
12,676 |
12,107 |
11,865 |
11,508 |
11,428 |
|
|
|
|
|
|
|
|
|
|
|
|
|
% Day |
47.6% |
51.1% |
52.8% |
52.2% |
50.6% |
50.0% |
51.9% |
52.3% |
48.8% |
47.1% |
|
% Evening |
32.1% |
30.0% |
28.7% |
27.3% |
25.0% |
25.4% |
24.7% |
24.0% |
23.1% |
22.1% |
|
%Weekend |
7.2% |
6.8% |
6.4% |
6.5% |
6.7% |
6.6% |
5.5% |
5.3% |
7.8% |
8.1% |
|
%Non-Traditional |
12.9% |
11.9% |
12.0% |
14.0% |
17.3% |
17.6% |
17.6% |
18.1% |
20.0% |
22.4% |
|
%Unknown |
0.1% |
0.2% |
0.1% |
0.1% |
0.4% |
0.4% |
0.3% |
0.4% |
0.3% |
0.3% |
|
|
|
|
|
|
|
|
|
|
|
|
|
Print in landscape for best results |
Last updated on |
September 24, 2018 |
|
Source:
Official 45th Day headcount as reported by colleges. |
|
Maricopa Community College District • Office of
Institutional Effectiveness • Maricopa Trends |
|
|
|
|
|
|
|
|
|
|
|
|