|
|
|
|
|
|
|
|
|
|
|
|
|
|
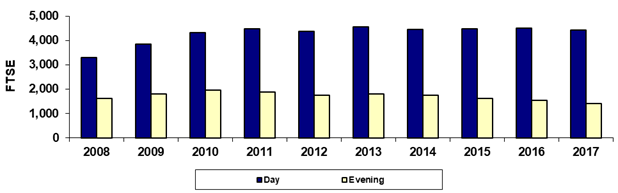
Phoenix College |
|
|
Fall 45th Day Day/Evening FTSE |
|
|
|
|
|
|
|
|
|
|
|
|
|
|
|
|
|
|
|
|
|
|
|
|
|
|
|
|
|
|
|
|
|
|
|
|
|
|
|
|
|
|
|
|
|
|
|
|
|
|
|
|
|
|
|
|
|
|
|
|
|
|
|
|
|
|
|
|
|
|
|
|
|
|
|
|
|
|
|
|
|
|
|
|
|
|
|
|
|
|
|
|
|
|
|
|
|
|
|
|
|
|
|
|
|
|
|
|
|
|
|
|
|
|
|
|
|
|
|
|
|
|
|
|
|
|
|
|
|
|
|
|
|
|
|
|
|
|
|
|
|
|
|
|
|
|
|
|
|
|
|
|
|
|
|
|
|
|
Year |
2008 |
2009 |
2010 |
2011 |
2012 |
2013 |
2014 |
2015 |
2016 |
2017 |
|
|
Day |
3,290.5 |
3,855.8 |
4,326.9 |
4,487.2 |
4,358.9 |
4,541.0 |
4,452.2 |
4,468.3 |
4,491.5 |
4,433.0 |
|
|
Evening |
1,609.5 |
1,793.0 |
1,953.5 |
1,874.5 |
1,739.8 |
1,796.6 |
1,745.9 |
1,607.4 |
1,527.5 |
1,419.5 |
|
|
Total |
4,900.0 |
5,648.8 |
6,280.4 |
6,361.6 |
6,098.7 |
6,337.6 |
6,198.1 |
6,075.6 |
6,019.0 |
5,852.6 |
|
|
|
|
|
|
|
|
|
|
|
|
|
|
|
% Day |
67.2% |
68.3% |
68.9% |
70.5% |
71.5% |
71.7% |
71.8% |
73.5% |
74.6% |
75.7% |
|
|
% Evening |
32.8% |
31.7% |
31.1% |
29.5% |
28.5% |
28.3% |
28.2% |
26.5% |
25.4% |
24.3% |
|
|
|
|
|
|
|
|
|
|
|
|
|
|
|
Due to rounding, the sum of the numbers may not
equal the Total. |
|
|
Print in landscape for best results |
Last updated on |
September 24, 2018 |
|
|
Source:
Offical 45th Day FTSE numbers as reported by the colleges after manual
adjustments (unaudited). |
|
|
Maricopa Community College District • Office of
Institutional Effectiveness • Maricopa Trends |
|
|
|
|
|
|
|
|
|
|
|
|
|
|