|
|
|
|
|
|
|
|
|
|
|
|
|
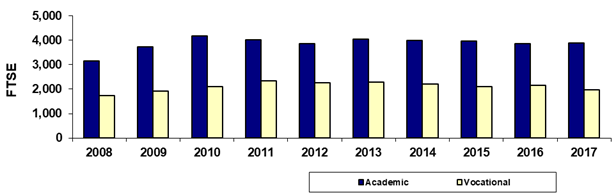
Phoenix College |
|
Fall 45th Day Academic/Vocational FTSE |
|
|
|
|
|
|
|
|
|
|
|
|
|
|
Year |
2008 |
2009 |
2010 |
2011 |
2012 |
2013 |
2014 |
2015 |
2016 |
2017 |
|
Academic |
3,161.6 |
3,721.3 |
4,173.8 |
4,016.2 |
3,847.7 |
4,043.8 |
3,988.4 |
3,978.3 |
3,867.5 |
3,884.0 |
|
Vocational |
1,738.4 |
1,927.5 |
2,106.6 |
2,345.5 |
2,251.0 |
2,293.7 |
2,209.7 |
2,097.4 |
2,151.5 |
1,968.6 |
|
Total |
4,900.0 |
5,648.8 |
6,280.4 |
6,361.6 |
6,098.7 |
6,337.6 |
6,198.1 |
6,075.6 |
6,019.0 |
5,852.6 |
|
|
|
|
|
|
|
|
|
|
|
|
|
% Academic |
64.5% |
65.9% |
66.5% |
63.1% |
63.1% |
63.8% |
64.3% |
65.5% |
64.3% |
66.4% |
|
% Vocational |
35.5% |
34.1% |
33.5% |
36.9% |
36.9% |
36.2% |
35.7% |
34.5% |
35.7% |
33.6% |
|
|
|
|
|
|
|
|
|
|
|
|
|
Due to rounding, the sum of the numbers may not
equal the Total. |
|
Print in landscape for best results |
Last updated on |
September 24, 2018 |
|
Source:
Offical 45th Day FTSE numbers as reported by the colleges after manual
adjustments (unaudited). |
|
Maricopa Community College District • Office of
Institutional Effectiveness • Maricopa Trends |
|
|
|
|
|
|
|
|
|
|
|
|