|
|
|
|
|
|
|
|
|
|
|
|
|
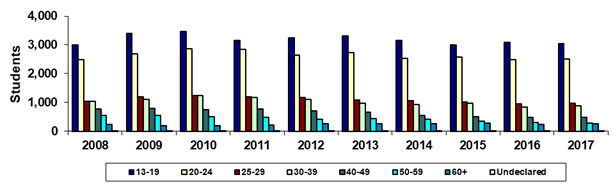
Paradise Valley Community College |
|
Fall 45th Day Age Groups |
|
|
|
|
|
|
|
|
|
|
|
|
|
|
|
|
|
|
|
|
|
|
|
|
|
Year |
2008 |
2009 |
2010 |
2011 |
2012 |
2013 |
2014 |
2015 |
2016 |
2017 |
|
13-19 |
2,996 |
3,403 |
3,462 |
3,165 |
3,245 |
3,316 |
3,144 |
2,989 |
3,089 |
3,044 |
|
20-24 |
2,480 |
2,692 |
2,866 |
2,852 |
2,645 |
2,741 |
2,533 |
2,566 |
2,483 |
2,514 |
|
25-29 |
1,029 |
1,204 |
1,242 |
1,193 |
1,166 |
1,090 |
1,058 |
1,007 |
956 |
967 |
|
30-39 |
1,029 |
1,108 |
1,231 |
1,173 |
1,109 |
980 |
939 |
964 |
845 |
887 |
|
40-49 |
778 |
787 |
755 |
770 |
711 |
652 |
552 |
514 |
475 |
490 |
|
50-59 |
543 |
547 |
516 |
489 |
408 |
431 |
406 |
347 |
295 |
289 |
|
60+ |
231 |
200 |
201 |
224 |
263 |
262 |
264 |
290 |
248 |
252 |
|
Undeclared |
19 |
10 |
9 |
8 |
8 |
5 |
13 |
7 |
2 |
4 |
|
Sum of Colleges* |
9,105 |
9,951 |
10,282 |
9,874 |
9,555 |
9,477 |
8,909 |
8,684 |
8,393 |
8,447 |
|
|
|
|
|
|
|
|
|
|
|
|
|
% 13-19 |
32.9% |
34.2% |
33.7% |
32.1% |
34.0% |
35.0% |
35.3% |
34.4% |
36.8% |
36.0% |
|
% 20-24 |
27.2% |
27.1% |
27.9% |
28.9% |
27.7% |
28.9% |
28.4% |
29.5% |
29.6% |
29.8% |
|
% 25-29 |
11.3% |
12.1% |
12.1% |
12.1% |
12.2% |
11.5% |
11.9% |
11.6% |
11.4% |
11.4% |
|
% 30-39 |
11.3% |
11.1% |
12.0% |
11.9% |
11.6% |
10.3% |
10.5% |
11.1% |
10.1% |
10.5% |
|
% 40-49 |
8.5% |
7.9% |
7.3% |
7.8% |
7.4% |
6.9% |
6.2% |
5.9% |
5.7% |
5.8% |
|
% 50-59 |
6.0% |
5.5% |
5.0% |
5.0% |
4.3% |
4.5% |
4.6% |
4.0% |
3.5% |
3.4% |
|
% 60+ |
2.5% |
2.0% |
2.0% |
2.3% |
2.8% |
2.8% |
3.0% |
3.3% |
3.0% |
3.0% |
|
% Undeclared |
0.2% |
0.1% |
0.1% |
0.1% |
0.1% |
0.1% |
0.1% |
0.1% |
0.0% |
0.0% |
|
|
|
|
|
|
|
|
|
|
|
|
|
Print in landscape for best results |
Last updated on |
September 24, 2018 |
|
Source:
Official 45th Day headcount as reported by colleges. |
|
Maricopa Community College District • Office of
Institutional Effectiveness • Maricopa Trends |
|
|
|
|
|
|
|
|
|
|
|
|