|
|
|
|
|
|
|
|
|
|
|
|
|
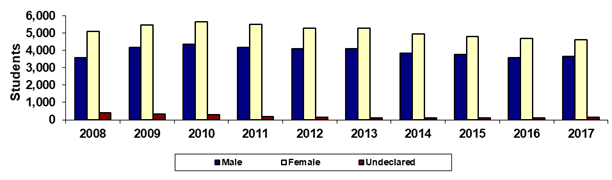
Paradise Valley Community College |
|
Fall 45th Day Gender |
|
|
|
|
|
|
|
|
|
|
|
|
|
|
|
|
|
|
|
|
|
|
|
|
|
Year |
2008 |
2009 |
2010 |
2011 |
2012 |
2013 |
2014 |
2015 |
2016 |
2017 |
|
Male |
3,602 |
4,159 |
4,352 |
4,166 |
4,110 |
4,085 |
3,844 |
3,755 |
3,582 |
3,674 |
|
Female |
5,083 |
5,454 |
5,650 |
5,514 |
5,291 |
5,266 |
4,954 |
4,808 |
4,682 |
4,628 |
|
Undeclared |
420 |
338 |
280 |
194 |
154 |
126 |
111 |
121 |
129 |
145 |
|
Total |
9,105 |
9,951 |
10,282 |
9,874 |
9,555 |
9,477 |
8,909 |
8,684 |
8,393 |
8,447 |
|
|
|
% Male |
39.6% |
41.8% |
42.3% |
42.2% |
43.0% |
43.1% |
43.1% |
43.2% |
42.7% |
43.5% |
|
% Female |
55.8% |
54.8% |
55.0% |
55.8% |
55.4% |
55.6% |
55.6% |
55.4% |
55.8% |
54.8% |
|
% Undeclared |
4.6% |
3.4% |
2.7% |
2.0% |
1.6% |
1.3% |
1.2% |
1.4% |
1.5% |
1.7% |
|
|
|
|
|
|
|
|
|
|
|
|
|
Print in landscape for best results |
Last updated on |
September 24, 2018 |
|
Source:
Official 45th Day headcount as reported by colleges. |
|
Maricopa Community College District • Office of
Institutional Effectiveness • Maricopa Trends |
|
|
|
|
|
|
|
|
|
|
|
|