|
|
|
|
|
|
|
|
|
|
|
|
|
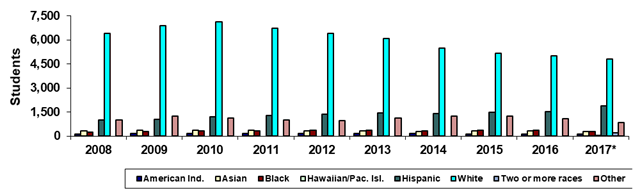
Paradise Valley Community College |
|
Fall 45th Day Ethnicity |
|
|
|
|
|
|
|
|
|
|
|
|
|
|
Year |
2008 |
2009 |
2010 |
2011 |
2012 |
2013 |
2014 |
2015 |
2016 |
2017* |
|
American Ind. |
127 |
148 |
158 |
152 |
148 |
152 |
147 |
134 |
132 |
111 |
|
Asian |
336 |
353 |
368 |
356 |
331 |
319 |
296 |
324 |
330 |
277 |
|
Black |
240 |
271 |
314 |
327 |
354 |
345 |
326 |
350 |
347 |
296 |
|
Hawaiian/Pac. Isl. |
0 |
0 |
0 |
0 |
0 |
0 |
0 |
0 |
0 |
11 |
|
Hispanic |
989 |
1,042 |
1,219 |
1,300 |
1,353 |
1,454 |
1,405 |
1,486 |
1,517 |
1,874 |
|
White |
6,403 |
6,891 |
7,118 |
6,737 |
6,419 |
6,101 |
5,492 |
5,161 |
4,998 |
4,801 |
|
Two or more races |
0 |
0 |
0 |
0 |
0 |
0 |
0 |
0 |
0 |
219 |
|
Other |
1,010 |
1,246 |
1,105 |
1,002 |
950 |
1,106 |
1,243 |
1,229 |
1,069 |
858 |
|
Total |
9,105 |
9,951 |
10,282 |
9,874 |
9,555 |
9,477 |
8,909 |
8,684 |
8,393 |
8,447 |
|
|
|
|
|
|
|
|
|
|
|
|
|
% American Ind. |
1.4% |
1.5% |
1.5% |
1.5% |
1.5% |
1.6% |
1.7% |
1.5% |
1.6% |
1.3% |
|
% Asian |
3.7% |
3.5% |
3.6% |
3.6% |
3.5% |
3.4% |
3.3% |
3.7% |
3.9% |
3.3% |
|
% Black |
2.6% |
2.7% |
3.1% |
3.3% |
3.7% |
3.6% |
3.7% |
4.0% |
4.1% |
3.5% |
|
% Hawaiian/Pac. Isl. |
0.0% |
0.0% |
0.0% |
0.0% |
0.0% |
0.0% |
0.0% |
0.0% |
0.0% |
0.1% |
|
% Hispanic |
10.9% |
10.5% |
11.9% |
13.2% |
14.2% |
15.3% |
15.8% |
17.1% |
18.1% |
22.2% |
|
% White |
70.3% |
69.2% |
69.2% |
68.2% |
67.2% |
64.4% |
61.6% |
59.4% |
59.5% |
56.8% |
|
%Two or more races |
0.0% |
0.0% |
0.0% |
0.0% |
0.0% |
0.0% |
0.0% |
0.0% |
0.0% |
2.6% |
|
% Other |
11.1% |
12.5% |
10.7% |
10.1% |
9.9% |
11.7% |
14.0% |
14.2% |
12.7% |
10.2% |
|
|
|
|
|
|
|
|
|
|
|
|
|
Print in landscape for best results |
Last updated on |
September 24, 2018 |
|
Source:
Official 45th Day headcount as reported by colleges. |
|
Maricopa Community College District • Office of
Institutional Effectiveness • Maricopa Trends |
|
*Beginning in Fall 2017, race-ethnicity categories
changed to provide counts for "Hawaiian/Pacific Islander" and
"Two or more races." |
|
|
|
|
|
|
|
|
|
|
|
|
|
|
|
|
|
|
|
|
|
|
|
|