|
|
|
|
|
|
|
|
|
|
|
|
|
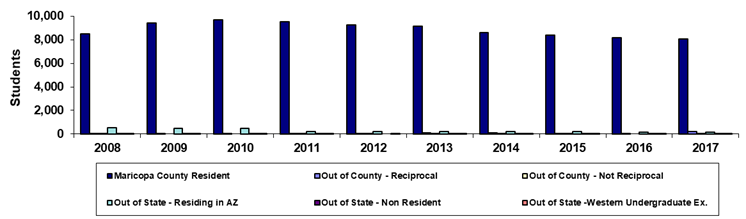
Paradise Valley Community College |
|
|
|
|
|
|
|
|
|
|
|
|
|
|
|
|
|
|
|
|
|
|
|
|
|
|
|
|
|
|
|
|
|
|
|
|
|
|
|
|
|
|
|
|
|
|
|
|
|
|
|
|
|
|
|
|
|
|
|
|
|
|
|
|
|
|
|
|
|
|
|
|
|
|
|
|
|
|
|
|
|
|
|
|
|
|
|
|
|
|
|
|
|
|
|
|
|
|
|
|
|
|
|
|
|
|
|
|
|
|
|
|
|
|
|
|
|
|
|
|
|
|
|
|
|
|
|
|
|
|
|
|
|
|
|
|
|
|
|
|
|
|
|
|
|
|
|
Year |
2008 |
2009 |
2010 |
2011 |
2012 |
2013 |
2014 |
2015 |
2016 |
2017 |
|
Maricopa County Resident |
8,502 |
9,424 |
9,725 |
9,561 |
9,249 |
9,161 |
8,620 |
8,414 |
8,177 |
8,085 |
|
Out of County - Reciprocal |
50 |
52 |
55 |
68 |
62 |
75 |
79 |
52 |
35 |
181 |
|
Out of County - Not Reciprocal |
1 |
0 |
0 |
1 |
1 |
2 |
2 |
1 |
0 |
6 |
|
Out of State - Residing in AZ |
530 |
459 |
473 |
219 |
208 |
209 |
184 |
185 |
145 |
155 |
|
Out of State - Non Resident |
10 |
4 |
3 |
3 |
0 |
2 |
1 |
4 |
8 |
3 |
|
Out of State -Western Undergraduate Ex. |
12 |
12 |
26 |
22 |
35 |
28 |
23 |
28 |
28 |
17 |
|
Total |
9,105 |
9,951 |
10,282 |
9,874 |
9,555 |
9,477 |
8,909 |
8,684 |
8,393 |
8,447 |
|
|
|
|
|
|
|
|
|
|
|
|
|
%Maricopa County Resident |
93.4% |
94.7% |
94.6% |
96.8% |
96.8% |
96.7% |
96.8% |
96.9% |
97.4% |
95.7% |
|
%Out of County - Reciprocal |
0.5% |
0.5% |
0.5% |
0.7% |
0.6% |
0.8% |
0.9% |
0.6% |
0.4% |
2.1% |
|
%Out of County - Not Reciprocal |
0.0% |
0.0% |
0.0% |
0.0% |
0.0% |
0.0% |
0.0% |
0.0% |
0.0% |
0.1% |
|
%Out of State - Residing in AZ |
5.8% |
4.6% |
4.6% |
2.2% |
2.2% |
2.2% |
2.1% |
2.1% |
1.7% |
1.8% |
|
%Out of State - Non Resident |
0.1% |
0.0% |
0.0% |
0.0% |
0.0% |
0.0% |
0.0% |
0.0% |
0.1% |
0.0% |
|
%Out of State -Western Undergraduate Ex. |
0.1% |
0.1% |
0.3% |
0.2% |
0.4% |
0.3% |
0.3% |
0.3% |
0.3% |
0.2% |
|
|
|
|
|
|
|
|
|
|
|
|
|
|
|
|
|
|
|
|
|
|
|
|
|
Print in landscape for best results |
Last updated on |
September 24, 2018 |
|
Source:
Official 45th Day headcount as reported by colleges. |
|
Maricopa Community College District • Office of
Institutional Effectiveness • Maricopa Trends |
|
|
|
|
|
|
|
|
|
|
|
|