|
|
|
|
|
|
|
|
|
|
|
|
|
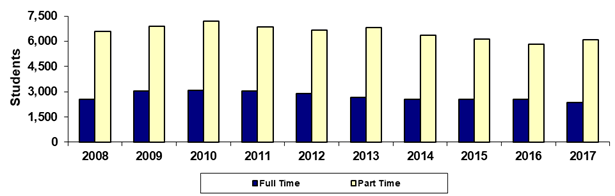
Paradise Valley Community College |
|
Fall 45th Day Academic Load (Full and Part Time) |
|
|
|
|
|
|
|
|
|
|
|
|
|
|
Year |
2008 |
2009 |
2010 |
2011 |
2012 |
2013 |
2014 |
2015 |
2016 |
2017 |
|
Full Time |
2,538 |
3,043 |
3,070 |
3,038 |
2,898 |
2,680 |
2,565 |
2,551 |
2,554 |
2,360 |
|
Part Time |
6,567 |
6,908 |
7,212 |
6,836 |
6,657 |
6,797 |
6,344 |
6,133 |
5,839 |
6,087 |
|
Total |
9,105 |
9,951 |
10,282 |
9,874 |
9,555 |
9,477 |
8,909 |
8,684 |
8,393 |
8,447 |
|
|
|
|
|
|
|
|
|
|
|
|
|
% Full Time |
27.9% |
30.6% |
29.9% |
30.8% |
30.3% |
28.3% |
28.8% |
29.4% |
30.4% |
27.9% |
|
% Part Time |
72.1% |
69.4% |
70.1% |
69.2% |
69.7% |
71.7% |
71.2% |
70.6% |
69.6% |
72.1% |
|
|
|
|
|
|
|
|
|
|
|
|
|
Print in landscape for best results |
Last updated on |
September 24, 2018 |
|
Source:
Official 45th Day headcount as reported by colleges. |
|
Maricopa Community College District • Office of
Institutional Effectiveness • Maricopa Trends |
|
|
|
|
|
|
|
|
|
|
|
|