|
|
|
|
|
|
|
|
|
|
|
|
|
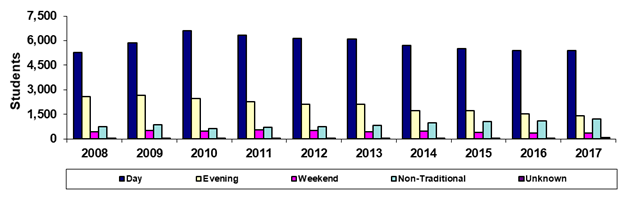
Paradise Valley Community College |
|
Fall 45th Day Headcount by Primary Time of
Attendance |
|
|
|
|
|
|
|
|
|
|
|
|
|
|
Year |
2008 |
2009 |
2010 |
2011 |
2012 |
2013 |
2014 |
2015 |
2016 |
2017 |
|
Day |
5,277 |
5,867 |
6,620 |
6,347 |
6,138 |
6,084 |
5,712 |
5,497 |
5,395 |
5,405 |
|
Evening |
2,602 |
2,670 |
2,483 |
2,261 |
2,123 |
2,114 |
1,731 |
1,737 |
1,532 |
1,398 |
|
Weekend |
454 |
498 |
494 |
553 |
518 |
432 |
490 |
400 |
366 |
365 |
|
Non-Traditional |
762 |
857 |
643 |
691 |
764 |
836 |
974 |
1,048 |
1,099 |
1,210 |
|
Unknown |
10 |
59 |
42 |
22 |
12 |
11 |
2 |
2 |
1 |
69 |
|
Total |
9,105 |
9,951 |
10,282 |
9,874 |
9,555 |
9,477 |
8,909 |
8,684 |
8,393 |
8,447 |
|
|
|
|
|
|
|
|
|
|
|
|
|
% Day |
58.0% |
59.0% |
64.4% |
64.3% |
64.2% |
64.2% |
64.1% |
63.3% |
64.3% |
64.0% |
|
% Evening |
28.6% |
26.8% |
24.1% |
22.9% |
22.2% |
22.3% |
19.4% |
20.0% |
18.3% |
16.6% |
|
%Weekend |
5.0% |
5.0% |
4.8% |
5.6% |
5.4% |
4.6% |
5.5% |
4.6% |
4.4% |
4.3% |
|
%Non-Traditional |
8.4% |
8.6% |
6.3% |
7.0% |
8.0% |
8.8% |
10.9% |
12.1% |
13.1% |
14.3% |
|
%Unknown |
0.1% |
0.6% |
0.4% |
0.2% |
0.1% |
0.1% |
0.0% |
0.0% |
0.0% |
0.8% |
|
|
|
|
|
|
|
|
|
|
|
|
|
Print in landscape for best results |
Last updated on |
September 24, 2018 |
|
Source:
Official 45th Day headcount as reported by colleges. |
|
Maricopa Community College District • Office of
Institutional Effectiveness • Maricopa Trends |
|
|
|
|
|
|
|
|
|
|
|
|