|
|
|
|
|
|
|
|
|
|
|
|
|
|
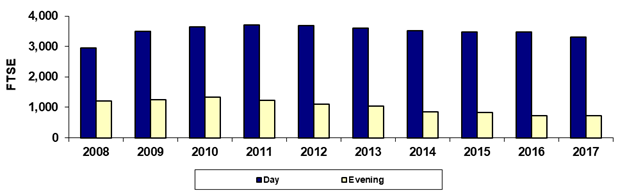
Paradise Valley Community College |
|
|
Fall 45th Day Day/Evening FTSE |
|
|
|
|
|
|
|
|
|
|
|
|
|
|
|
|
|
|
|
|
|
|
|
|
|
|
|
|
|
|
|
|
|
|
|
|
|
|
|
|
|
|
|
|
|
|
|
|
|
|
|
|
|
|
|
|
|
|
|
|
|
|
|
|
|
|
|
|
|
|
|
|
|
|
|
|
|
|
|
|
|
|
|
|
|
|
|
|
|
|
|
|
|
|
|
|
|
|
|
|
|
|
|
|
|
|
|
|
|
|
|
|
|
|
|
|
|
|
|
|
|
|
|
|
|
|
|
|
|
|
|
|
|
|
|
|
|
|
|
|
|
|
|
|
|
|
|
|
|
|
|
|
|
|
|
|
|
|
Year |
2008 |
2009 |
2010 |
2011 |
2012 |
2013 |
2014 |
2015 |
2016 |
2017 |
|
|
Day |
2,950.1 |
3,498.8 |
3,637.6 |
3,712.0 |
3,676.7 |
3,607.6 |
3,524.5 |
3,469.0 |
3,479.0 |
3,312.7 |
|
|
Evening |
1,211.9 |
1,249.5 |
1,331.0 |
1,237.5 |
1,095.2 |
1,034.1 |
857.0 |
831.9 |
724.1 |
717.9 |
|
|
Total |
4,162.0 |
4,748.3 |
4,968.7 |
4,949.5 |
4,771.9 |
4,641.7 |
4,381.5 |
4,300.9 |
4,203.1 |
4,030.7 |
|
|
|
|
|
|
|
|
|
|
|
|
|
|
|
% Day |
70.9% |
73.7% |
73.2% |
75.0% |
77.0% |
77.7% |
80.4% |
80.7% |
82.8% |
82.2% |
|
|
% Evening |
29.1% |
26.3% |
26.8% |
25.0% |
23.0% |
22.3% |
19.6% |
19.3% |
17.2% |
17.8% |
|
|
|
|
|
|
|
|
|
|
|
|
|
|
|
Due to rounding, the sum of the numbers may not
equal the Total. |
|
|
Print in landscape for best results |
Last updated on |
September 24, 2018 |
|
|
Source:
Offical 45th Day FTSE numbers as reported by the colleges after manual
adjustments (unaudited). |
|
|
Maricopa Community College District • Office of
Institutional Effectiveness • Maricopa Trends |
|
|
|
|
|
|
|
|
|
|
|
|
|
|