|
|
|
|
|
|
|
|
|
|
|
|
|
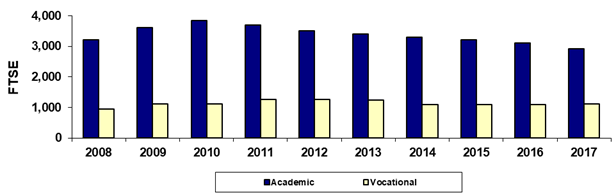
Paradise Valley Community College |
|
Fall 45th Day Academic/Vocational FTSE |
|
|
|
|
|
|
|
|
|
|
|
|
|
|
Year |
2008 |
2009 |
2010 |
2011 |
2012 |
2013 |
2014 |
2015 |
2016 |
2017 |
|
Academic |
3,206.8 |
3,623.4 |
3,843.3 |
3,694.9 |
3,510.0 |
3,401.6 |
3,293.5 |
3,206.7 |
3,109.4 |
2,913.3 |
|
Vocational |
955.3 |
1,124.9 |
1,125.4 |
1,254.6 |
1,261.9 |
1,240.0 |
1,088.0 |
1,094.2 |
1,093.7 |
1,117.4 |
|
Total |
4,162.0 |
4,748.3 |
4,968.7 |
4,949.5 |
4,771.9 |
4,641.7 |
4,381.5 |
4,300.9 |
4,203.1 |
4,030.7 |
|
|
|
|
|
|
|
|
|
|
|
|
|
% Academic |
77.0% |
76.3% |
77.4% |
74.7% |
73.6% |
73.3% |
75.2% |
74.6% |
74.0% |
72.3% |
|
% Vocational |
23.0% |
23.7% |
22.6% |
25.3% |
26.4% |
26.7% |
24.8% |
25.4% |
26.0% |
27.7% |
|
|
|
|
|
|
|
|
|
|
|
|
|
Due to rounding, the sum of the numbers may not
equal the Total. |
|
Print in landscape for best results |
Last updated on |
September 24, 2018 |
|
Source:
Offical 45th Day FTSE numbers as reported by the colleges after manual
adjustments (unaudited). |
|
Maricopa Community College District • Office of
Institutional Effectiveness • Maricopa Trends |
|
|
|
|
|
|
|
|
|
|
|
|