|
|
|
|
|
|
|
|
|
|
|
|
|
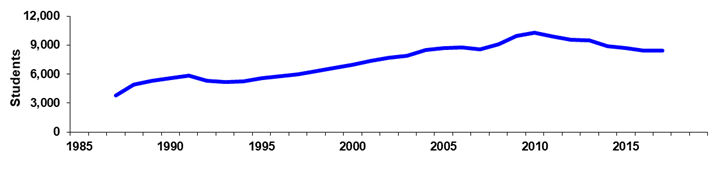
Paradise Valley Community College |
|
Fall 45th Day Historical Headcount |
|
|
|
|
|
|
|
|
|
|
|
|
|
|
|
|
|
|
|
|
|
|
|
|
|
Year |
1980 |
1981 |
1982 |
1983 |
1984 |
1985 |
1986 |
1987 |
1988 |
1989 |
|
Day |
|
|
|
|
|
|
|
1,444 |
2,342 |
2,688 |
|
% Change |
|
|
|
|
|
|
|
0.0% |
62.2% |
14.8% |
|
Evening |
|
|
|
|
|
|
|
2,337 |
2,595 |
2,620 |
|
% Change |
|
|
|
|
|
|
|
0.0% |
11.0% |
1.0% |
|
Total |
|
|
|
|
|
|
|
3,781 |
4,937 |
5,308 |
|
% Change |
|
|
|
|
|
|
|
0.0% |
30.6% |
7.5% |
|
|
|
|
|
|
|
|
|
|
|
|
|
Year |
1990 |
1991 |
1992 |
1993 |
1994 |
1995 |
1996 |
1997 |
1998 |
1999 |
|
Day |
3,171 |
2,893 |
3,099 |
3,073 |
2,808 |
3,073 |
3,431 |
3,554 |
3,644 |
3,879 |
|
% Change |
18.0% |
-8.8% |
7.1% |
-0.8% |
-8.6% |
9.4% |
11.6% |
3.6% |
2.5% |
6.4% |
|
Evening |
2,387 |
2,969 |
2,214 |
2,106 |
2,427 |
2,501 |
2,355 |
2,453 |
2,656 |
2,753 |
|
% Change |
-8.9% |
24.4% |
-25.4% |
-4.9% |
15.2% |
3.0% |
-5.8% |
4.2% |
8.3% |
3.7% |
|
Total |
5,558 |
5,862 |
5,313 |
5,179 |
5,235 |
5,574 |
5,786 |
6,007 |
6,300 |
6,632 |
|
% Change |
4.7% |
5.5% |
-9.4% |
-2.5% |
1.1% |
6.5% |
3.8% |
3.8% |
4.9% |
5.3% |
|
|
|
|
|
|
|
|
|
|
|
|
|
Year |
2000 |
2001 |
2002 |
2003 |
2004 |
2005 |
2006 |
2007 |
2008 |
2009 |
|
Day |
4,183 |
4,572 |
4,726 |
4,917 |
5,319 |
5,363 |
5,573 |
5,633 |
0 |
0 |
|
% Change |
7.8% |
9.3% |
3.4% |
4.0% |
8.2% |
0.8% |
3.9% |
1.1% |
0.0% |
0.0% |
|
Evening |
2,817 |
2,777 |
2,983 |
2,962 |
3,197 |
3,354 |
3,184 |
2,941 |
0 |
0 |
|
% Change |
2.3% |
-1.4% |
7.4% |
-0.7% |
7.9% |
4.9% |
-5.1% |
-7.6% |
0.0% |
0.0% |
|
Total |
7,000 |
7,349 |
7,709 |
7,879 |
8,516 |
8,717 |
8,757 |
8,574 |
9,105 |
9,951 |
|
% Change |
5.5% |
5.0% |
4.9% |
2.2% |
8.1% |
2.4% |
0.5% |
-2.1% |
6.2% |
9.3% |
|
|
|
|
|
|
|
|
|
|
|
|
|
Year |
2010 |
2011 |
2012 |
2013 |
2014 |
2015 |
2016 |
2017 |
|
|
|
Day |
0 |
|
|
|
|
|
|
|
|
|
|
% Change |
0.0% |
|
|
|
|
|
|
|
|
|
|
Evening |
0 |
|
|
|
|
|
|
|
|
|
|
% Change |
0.0% |
|
|
|
|
|
|
|
|
|
|
Total |
10,282 |
9,874 |
9,555 |
9,477 |
8,909 |
8,684 |
8,393 |
8,447 |
|
|
|
% Change |
3.3% |
-4.0% |
-3.2% |
-0.8% |
-6.0% |
-2.5% |
-3.4% |
0.6% |
|
|
|
|
|
|
|
|
|
|
|
|
|
|
|
|
|
|
|
|
|
|
|
|
|
|
|
Print in landscape for
best results |
|
|
|
|
|
Last updated on |
September 24, 2018 |
|
Source:
Official 45th Day headcount as reported by colleges. |
|
Maricopa Community College District • Office of
Institutional Effectiveness • Maricopa Trends |
|
|
|
|
|
|
|
|
|
|
|
|