|
|
|
|
|
|
|
|
|
|
|
|
|
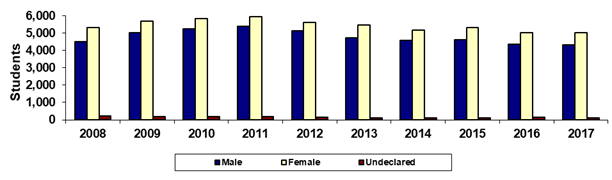
Scottsdale Community College |
|
Fall 45th Day Gender |
|
|
|
|
|
|
|
|
|
|
|
|
|
|
|
|
|
|
|
|
|
|
|
|
|
Year |
2008 |
2009 |
2010 |
2011 |
2012 |
2013 |
2014 |
2015 |
2016 |
2017 |
|
Male |
4,524 |
5,037 |
5,262 |
5,404 |
5,131 |
4,741 |
4,567 |
4,629 |
4,376 |
4,310 |
|
Female |
5,322 |
5,682 |
5,826 |
5,941 |
5,618 |
5,452 |
5,184 |
5,327 |
5,034 |
5,027 |
|
Undeclared |
231 |
204 |
169 |
203 |
146 |
120 |
112 |
127 |
141 |
121 |
|
Total |
10,077 |
10,923 |
11,257 |
11,548 |
10,895 |
10,313 |
9,863 |
10,083 |
9,551 |
9,458 |
|
|
|
% Male |
44.9% |
46.1% |
46.7% |
46.8% |
47.1% |
46.0% |
46.3% |
45.9% |
45.8% |
45.6% |
|
% Female |
52.8% |
52.0% |
51.8% |
51.4% |
51.6% |
52.9% |
52.6% |
52.8% |
52.7% |
53.2% |
|
% Undeclared |
2.3% |
1.9% |
1.5% |
1.8% |
1.3% |
1.2% |
1.1% |
1.3% |
1.5% |
1.3% |
|
|
|
|
|
|
|
|
|
|
|
|
|
Print in landscape for best results |
Last updated on |
September 24, 2018 |
|
Source:
Official 45th Day headcount as reported by colleges. |
|
Maricopa Community College District • Office of
Institutional Effectiveness • Maricopa Trends |
|
|
|
|
|
|
|
|
|
|
|
|