|
|
|
|
|
|
|
|
|
|
|
|
|
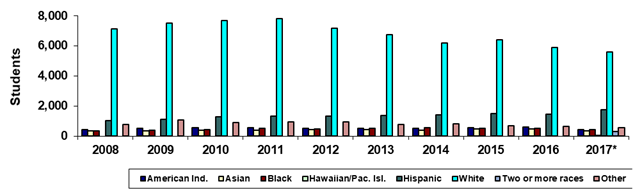
Scottsdale Community College |
|
Fall 45th Day Ethnicity |
|
|
|
|
|
|
|
|
|
|
|
|
|
|
Year |
2008 |
2009 |
2010 |
2011 |
2012 |
2013 |
2014 |
2015 |
2016 |
2017* |
|
American Ind. |
448 |
502 |
555 |
570 |
530 |
521 |
525 |
545 |
584 |
440 |
|
Asian |
349 |
361 |
386 |
408 |
421 |
419 |
400 |
463 |
451 |
352 |
|
Black |
347 |
380 |
447 |
498 |
490 |
501 |
539 |
504 |
525 |
410 |
|
Hawaiian/Pac. Isl. |
0 |
0 |
0 |
0 |
0 |
0 |
0 |
0 |
0 |
35 |
|
Hispanic |
1,037 |
1,102 |
1,283 |
1,312 |
1,339 |
1,362 |
1,403 |
1,487 |
1,460 |
1,768 |
|
White |
7,107 |
7,523 |
7,682 |
7,827 |
7,182 |
6,754 |
6,185 |
6,386 |
5,877 |
5,580 |
|
Two or more races |
0 |
0 |
0 |
0 |
0 |
0 |
0 |
0 |
0 |
314 |
|
Other |
789 |
1,055 |
904 |
933 |
933 |
756 |
811 |
698 |
654 |
559 |
|
Total |
10,077 |
10,923 |
11,257 |
11,548 |
10,895 |
10,313 |
9,863 |
10,083 |
9,551 |
9,458 |
|
|
|
|
|
|
|
|
|
|
|
|
|
% American Ind. |
4.4% |
4.6% |
4.9% |
4.9% |
4.9% |
5.1% |
5.3% |
5.4% |
6.1% |
4.7% |
|
% Asian |
3.5% |
3.3% |
3.4% |
3.5% |
3.9% |
4.1% |
4.1% |
4.6% |
4.7% |
3.7% |
|
% Black |
3.4% |
3.5% |
4.0% |
4.3% |
4.5% |
4.9% |
5.5% |
5.0% |
5.5% |
4.3% |
|
% Hawaiian/Pac. Isl. |
0.0% |
0.0% |
0.0% |
0.0% |
0.0% |
0.0% |
0.0% |
0.0% |
0.0% |
0.4% |
|
% Hispanic |
10.3% |
10.1% |
11.4% |
11.4% |
12.3% |
13.2% |
14.2% |
14.7% |
15.3% |
18.7% |
|
% White |
70.5% |
68.9% |
68.2% |
67.8% |
65.9% |
65.5% |
62.7% |
63.3% |
61.5% |
59.0% |
|
%Two or more races |
0.0% |
0.0% |
0.0% |
0.0% |
0.0% |
0.0% |
0.0% |
0.0% |
0.0% |
3.3% |
|
% Other |
7.8% |
9.7% |
8.0% |
8.1% |
8.6% |
7.3% |
8.2% |
6.9% |
6.8% |
5.9% |
|
|
|
|
|
|
|
|
|
|
|
|
|
Print in landscape for best results |
Last updated on |
September 24, 2018 |
|
Source:
Official 45th Day headcount as reported by colleges. |
|
Maricopa Community College District • Office of
Institutional Effectiveness • Maricopa Trends |
|
*Beginning in Fall 2017, race-ethnicity categories
changed to provide counts for "Hawaiian/Pacific Islander" and
"Two or more races." |
|
|
|
|
|
|
|
|
|
|
|
|
|
|
|
|
|
|
|
|
|
|
|
|