|
|
|
|
|
|
|
|
|
|
|
|
|
|
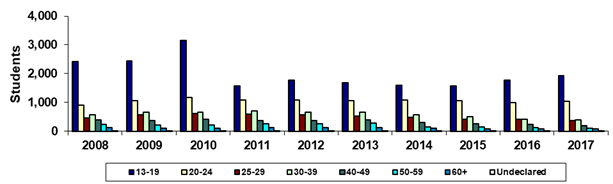
South Mountain Community College |
|
|
Fall 45th Day Age Groups |
|
|
|
|
|
|
|
|
|
|
|
|
|
|
|
|
|
|
|
|
|
|
|
|
|
|
|
|
|
|
|
|
|
|
|
|
|
|
Year |
2008 |
2009 |
2010 |
2011 |
2012 |
2013 |
2014 |
2015 |
2016 |
2017 |
|
|
13-19 |
2,418 |
2,451 |
3,160 |
1,580 |
1,777 |
1,677 |
1,591 |
1,570 |
1,769 |
1,931 |
|
|
20-24 |
916 |
1,060 |
1,169 |
1,090 |
1,089 |
1,060 |
1,079 |
1,072 |
1,001 |
1,043 |
|
|
25-29 |
462 |
572 |
617 |
594 |
562 |
518 |
492 |
424 |
419 |
373 |
|
|
30-39 |
563 |
650 |
659 |
699 |
663 |
664 |
565 |
507 |
422 |
389 |
|
|
40-49 |
399 |
378 |
411 |
376 |
368 |
388 |
296 |
261 |
230 |
201 |
|
|
50-59 |
234 |
221 |
221 |
265 |
263 |
273 |
157 |
157 |
131 |
108 |
|
|
60+ |
126 |
100 |
107 |
125 |
117 |
132 |
105 |
87 |
85 |
72 |
|
|
Undeclared |
20 |
12 |
10 |
9 |
4 |
6 |
2 |
5 |
1 |
3 |
|
|
Sum of Colleges* |
5,138 |
5,444 |
6,354 |
4,738 |
4,843 |
4,718 |
4,287 |
4,083 |
4,058 |
4,120 |
|
|
|
|
|
|
|
|
|
|
|
|
|
|
|
% 13-19 |
47.1% |
45.0% |
49.7% |
33.3% |
36.7% |
35.5% |
37.1% |
38.5% |
43.6% |
46.9% |
|
|
% 20-24 |
17.8% |
19.5% |
18.4% |
23.0% |
22.5% |
22.5% |
25.2% |
26.3% |
24.7% |
25.3% |
|
|
% 25-29 |
9.0% |
10.5% |
9.7% |
12.5% |
11.6% |
11.0% |
11.5% |
10.4% |
10.3% |
9.1% |
|
|
% 30-39 |
11.0% |
11.9% |
10.4% |
14.8% |
13.7% |
14.1% |
13.2% |
12.4% |
10.4% |
9.4% |
|
|
% 40-49 |
7.8% |
6.9% |
6.5% |
7.9% |
7.6% |
8.2% |
6.9% |
6.4% |
5.7% |
4.9% |
|
|
% 50-59 |
4.6% |
4.1% |
3.5% |
5.6% |
5.4% |
5.8% |
3.7% |
3.8% |
3.2% |
2.6% |
|
|
% 60+ |
2.5% |
1.8% |
1.7% |
2.6% |
2.4% |
2.8% |
2.4% |
2.1% |
2.1% |
1.7% |
|
|
% Undeclared |
0.4% |
0.2% |
0.2% |
0.2% |
0.1% |
0.1% |
0.0% |
0.1% |
0.0% |
0.1% |
|
|
|
|
|
|
|
|
|
|
|
|
|
|
|
Print in landscape for best results |
Last updated on |
September 24, 2018 |
|
|
Source:
Official 45th Day headcount as reported by colleges. |
|
|
Maricopa Community College District • Office of
Institutional Effectiveness • Maricopa Trends |
|
|
|
|
|
|
|
|
|
|
|
|
|
|