|
|
|
|
|
|
|
|
|
|
|
|
|
|
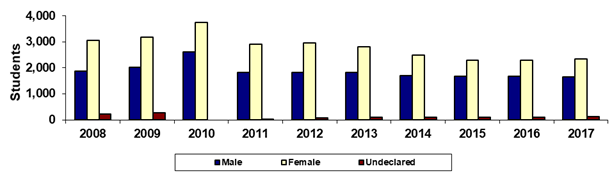
South Mountain Community College |
|
|
Fall 45th Day Gender |
|
|
|
|
|
|
|
|
|
|
|
|
|
|
|
|
|
|
|
|
|
|
|
|
|
|
|
|
|
|
|
|
|
|
|
|
|
|
Year |
2008 |
2009 |
2010 |
2011 |
2012 |
2013 |
2014 |
2015 |
2016 |
2017 |
|
|
Male |
1,873 |
2,011 |
2,613 |
1,821 |
1,827 |
1,821 |
1,705 |
1,680 |
1,668 |
1,660 |
|
|
Female |
3,044 |
3,171 |
3,741 |
2,901 |
2,945 |
2,800 |
2,489 |
2,302 |
2,296 |
2,333 |
|
|
Undeclared |
221 |
262 |
0 |
16 |
71 |
97 |
93 |
101 |
94 |
127 |
|
|
Total |
5,138 |
5,444 |
6,354 |
4,738 |
4,843 |
4,718 |
4,287 |
4,083 |
4,058 |
4,120 |
|
|
|
|
|
% Male |
36.5% |
36.9% |
41.1% |
38.4% |
37.7% |
38.6% |
39.8% |
41.1% |
41.1% |
40.3% |
|
|
% Female |
59.2% |
58.2% |
58.9% |
61.2% |
60.8% |
59.3% |
58.1% |
56.4% |
56.6% |
56.6% |
|
|
% Undeclared |
4.3% |
4.8% |
0.0% |
0.3% |
1.5% |
2.1% |
2.2% |
2.5% |
2.3% |
3.1% |
|
|
|
|
|
|
|
|
|
|
|
|
|
|
|
Print in landscape for best results |
Last updated on |
September 24, 2018 |
|
|
Source:
Official 45th Day headcount as reported by colleges. |
|
|
Maricopa Community College District • Office of
Institutional Effectiveness • Maricopa Trends |
|
|
|
|
|
|
|
|
|
|
|
|
|
|