|
|
|
|
|
|
|
|
|
|
|
|
|
|
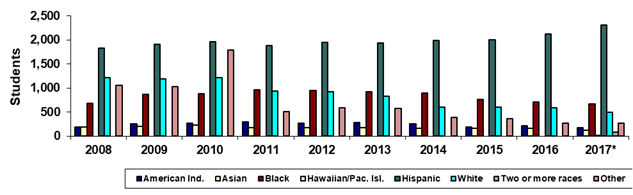
South Mountain Community College |
|
|
Fall 45th Day Ethnicity |
|
|
|
|
|
|
|
|
|
|
|
|
|
|
|
|
|
|
|
|
|
|
|
|
|
|
|
Year |
2008 |
2009 |
2010 |
2011 |
2012 |
2013 |
2014 |
2015 |
2016 |
2017* |
|
|
American Ind. |
189 |
257 |
274 |
289 |
265 |
283 |
252 |
191 |
209 |
177 |
|
|
Asian |
187 |
202 |
228 |
176 |
176 |
173 |
160 |
165 |
164 |
124 |
|
|
Black |
676 |
867 |
886 |
960 |
953 |
926 |
896 |
761 |
706 |
674 |
|
|
Hawaiian/Pac. Isl. |
0 |
0 |
0 |
0 |
0 |
0 |
0 |
0 |
0 |
9 |
|
|
Hispanic |
1,823 |
1,904 |
1,962 |
1,877 |
1,944 |
1,933 |
1,984 |
2,000 |
2,123 |
2,301 |
|
|
White |
1,209 |
1,189 |
1,211 |
933 |
916 |
827 |
604 |
599 |
582 |
488 |
|
|
Two or more races |
0 |
0 |
0 |
0 |
0 |
0 |
0 |
0 |
0 |
80 |
|
|
Other |
1,054 |
1,025 |
1,793 |
503 |
589 |
576 |
391 |
367 |
274 |
267 |
|
|
Total |
5,138 |
5,444 |
6,354 |
4,738 |
4,843 |
4,718 |
4,287 |
4,083 |
4,058 |
4,120 |
|
|
|
|
|
|
|
|
|
|
|
|
|
|
|
% American Ind. |
3.7% |
4.7% |
4.3% |
6.1% |
5.5% |
6.0% |
5.9% |
4.7% |
5.2% |
4.3% |
|
|
% Asian |
3.6% |
3.7% |
3.6% |
3.7% |
3.6% |
3.7% |
3.7% |
4.0% |
4.0% |
3.0% |
|
|
% Black |
13.2% |
15.9% |
13.9% |
20.3% |
19.7% |
19.6% |
20.9% |
18.6% |
17.4% |
16.4% |
|
|
% Hawaiian/Pac. Isl. |
0.0% |
0.0% |
0.0% |
0.0% |
0.0% |
0.0% |
0.0% |
0.0% |
0.0% |
0.2% |
|
|
% Hispanic |
35.5% |
35.0% |
30.9% |
39.6% |
40.1% |
41.0% |
46.3% |
49.0% |
52.3% |
55.8% |
|
|
% White |
23.5% |
21.8% |
19.1% |
19.7% |
18.9% |
17.5% |
14.1% |
14.7% |
14.3% |
11.8% |
|
|
%Two or more races |
0.0% |
0.0% |
0.0% |
0.0% |
0.0% |
0.0% |
0.0% |
0.0% |
0.0% |
1.9% |
|
|
% Other |
20.5% |
18.8% |
28.2% |
10.6% |
12.2% |
12.2% |
9.1% |
9.0% |
6.8% |
6.5% |
|
|
|
|
|
|
|
|
|
|
|
|
|
|
|
Print in landscape for best results |
Last updated on |
September 24, 2018 |
|
|
Source:
Official 45th Day headcount as reported by colleges. |
|
|
Maricopa Community College District • Office of
Institutional Effectiveness • Maricopa Trends |
|
|
*Beginning in Fall 2017, race-ethnicity categories
changed to provide counts for "Hawaiian/Pacific Islander" and
"Two or more races." |
|
|
|
|
|
|
|
|
|
|
|
|
|
|
|
|
|
|
|
|
|
|
|
|
|
|
|