|
|
|
|
|
|
|
|
|
|
|
|
|
|
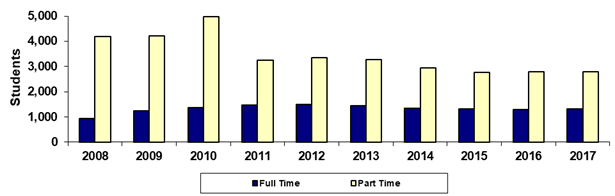
South Mountain Community College |
|
|
Fall 45th Day Academic Load (Full and Part Time) |
|
|
|
|
|
|
|
|
|
|
|
|
|
|
|
|
|
|
|
|
|
|
|
|
|
|
|
Year |
2008 |
2009 |
2010 |
2011 |
2012 |
2013 |
2014 |
2015 |
2016 |
2017 |
|
|
Full Time |
947 |
1,242 |
1,372 |
1,480 |
1,495 |
1,444 |
1,336 |
1,306 |
1,280 |
1,325 |
|
|
Part Time |
4,191 |
4,202 |
4,982 |
3,258 |
3,348 |
3,274 |
2,951 |
2,777 |
2,778 |
2,795 |
|
|
Total |
5,138 |
5,444 |
6,354 |
4,738 |
4,843 |
4,718 |
4,287 |
4,083 |
4,058 |
4,120 |
|
|
|
|
|
|
|
|
|
|
|
|
|
|
|
% Full Time |
18.4% |
22.8% |
21.6% |
31.2% |
30.9% |
30.6% |
31.2% |
32.0% |
31.5% |
32.2% |
|
|
% Part Time |
81.6% |
77.2% |
78.4% |
68.8% |
69.1% |
69.4% |
68.8% |
68.0% |
68.5% |
67.8% |
|
|
|
|
|
|
|
|
|
|
|
|
|
|
|
Print in landscape for best results |
Last updated on |
September 24, 2018 |
|
|
Source:
Official 45th Day headcount as reported by colleges. |
|
|
Maricopa Community College District • Office of
Institutional Effectiveness • Maricopa Trends |
|
|
|
|
|
|
|
|
|
|
|
|
|
|