|
|
|
|
|
|
|
|
|
|
|
|
|
|
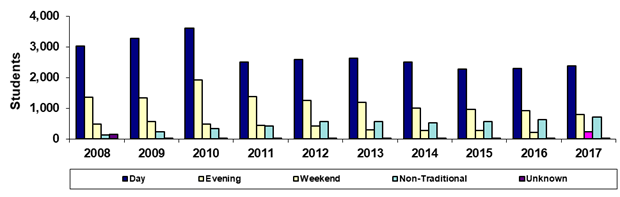
South Mountain Community College |
|
|
Fall 45th Day Headcount by Primary Time of
Attendance |
|
|
|
|
|
|
|
|
|
|
|
|
|
|
|
|
|
|
|
|
|
|
|
|
|
|
|
Year |
2008 |
2009 |
2010 |
2011 |
2012 |
2013 |
2014 |
2015 |
2016 |
2017 |
|
|
Day |
3,021 |
3,279 |
3,610 |
2,508 |
2,585 |
2,635 |
2,494 |
2,268 |
2,284 |
2,378 |
|
|
Evening |
1,357 |
1,340 |
1,924 |
1,374 |
1,262 |
1,192 |
1,003 |
953 |
918 |
800 |
|
|
Weekend |
475 |
569 |
485 |
432 |
416 |
292 |
274 |
282 |
222 |
233 |
|
|
Non-Traditional |
127 |
243 |
331 |
417 |
576 |
571 |
514 |
561 |
628 |
705 |
|
|
Unknown |
158 |
13 |
4 |
7 |
4 |
28 |
2 |
19 |
6 |
4 |
|
|
Total |
5,138 |
5,444 |
6,354 |
4,738 |
4,843 |
4,718 |
4,287 |
4,083 |
4,058 |
4,120 |
|
|
|
|
|
|
|
|
|
|
|
|
|
|
|
% Day |
58.8% |
60.2% |
56.8% |
52.9% |
53.4% |
55.8% |
58.2% |
55.5% |
56.3% |
57.7% |
|
|
% Evening |
26.4% |
24.6% |
30.3% |
29.0% |
26.1% |
25.3% |
23.4% |
23.3% |
22.6% |
19.4% |
|
|
%Weekend |
9.2% |
10.5% |
7.6% |
9.1% |
8.6% |
6.2% |
6.4% |
6.9% |
5.5% |
5.7% |
|
|
%Non-Traditional |
2.5% |
4.5% |
5.2% |
8.8% |
11.9% |
12.1% |
12.0% |
13.7% |
15.5% |
17.1% |
|
|
%Unknown |
3.1% |
0.2% |
0.1% |
0.1% |
0.1% |
0.6% |
0.0% |
0.5% |
0.1% |
0.1% |
|
|
|
|
|
|
|
|
|
|
|
|
|
|
|
Print in landscape for best results |
Last updated on |
September 24, 2018 |
|
|
Source:
Official 45th Day headcount as reported by colleges. |
|
|
Maricopa Community College District • Office of
Institutional Effectiveness • Maricopa Trends |
|
|
|
|
|
|
|
|
|
|
|
|
|
|