|
|
|
|
|
|
|
|
|
|
|
|
|
|
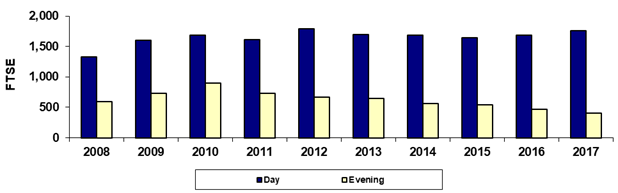
South Mountain Community College |
|
|
Fall 45th Day Day/Evening FTSE |
|
|
|
|
|
|
|
|
|
|
|
|
|
|
|
|
|
|
|
|
|
|
|
|
|
|
|
|
|
|
|
|
|
|
|
|
|
|
|
|
|
|
|
|
|
|
|
|
|
|
|
|
|
|
|
|
|
|
|
|
|
|
|
|
|
|
|
|
|
|
|
|
|
|
|
|
|
|
|
|
|
|
|
|
|
|
|
|
|
|
|
|
|
|
|
|
|
|
|
|
|
|
|
|
|
|
|
|
|
|
|
|
|
|
|
|
|
|
|
|
|
|
|
|
|
|
|
|
|
|
|
|
|
|
|
|
|
|
|
|
|
|
|
|
|
|
|
|
|
|
|
|
|
|
|
|
|
|
Year |
2008 |
2009 |
2010 |
2011 |
2012 |
2013 |
2014 |
2015 |
2016 |
2017 |
|
|
Day |
1,328.1 |
1,600.9 |
1,682.8 |
1,613.1 |
1,787.7 |
1,692.7 |
1,681.9 |
1,646.1 |
1,681.1 |
1,760.2 |
|
|
Evening |
596.2 |
728.8 |
895.4 |
725.4 |
666.9 |
642.5 |
558.9 |
542.0 |
468.1 |
406.5 |
|
|
Total |
1,924.3 |
2,329.7 |
2,578.2 |
2,338.5 |
2,454.7 |
2,335.3 |
2,240.8 |
2,188.1 |
2,149.2 |
2,166.7 |
|
|
|
|
|
|
|
|
|
|
|
|
|
|
|
% Day |
69.0% |
68.7% |
65.3% |
69.0% |
72.8% |
72.5% |
75.1% |
75.2% |
78.2% |
81.2% |
|
|
% Evening |
31.0% |
31.3% |
34.7% |
31.0% |
27.2% |
27.5% |
24.9% |
24.8% |
21.8% |
18.8% |
|
|
|
|
|
|
|
|
|
|
|
|
|
|
|
Due to rounding, the sum of the numbers may not
equal the Total. |
|
|
Print in landscape for best results |
Last updated on |
September 24, 2018 |
|
|
Source:
Offical 45th Day FTSE numbers as reported by the colleges after manual
adjustments (unaudited). |
|
|
Maricopa Community College District • Office of
Institutional Effectiveness • Maricopa Trends |
|
|
|
|
|
|
|
|
|
|
|
|
|
|